


Traditionally, when researchers need to model traffic patterns, getting the input data is not an easy task. “It’s tedious. You have to get a bunch of people to stand out and count the cars, and the types of cars, multiple times a day at multiple locations,” says Brian Freeman, team leader of air regulatory management for the United Nations Development Program’s Kuwait Integrated Management Project. Freeman wanted to devise a more efficient method for evaluating traffic congestion. “While I was sitting in traffic, as an actual participant in that congestion, I realized that the there’s a finite range of possibilities of where you’re going to be in your car.” By assigning vehicle spaces on a road based on the average speed, Freeman and his co-authors were able to treat each vehicle as an independent variable that could be analyzed via Monte Carlo simulation.
Air Regulatory Management, UNDP Kuwait Integrated Management Projectn
Establishing Assumptions about Grid-Locked Traffic
Freeman and his colleagues first assumed that each vehicle occupies road space based on its length and inter-vehicle gap during congested traffic. The inter-vehicle gap varies depending on driver behavior and average speed. Freeman assumed that all vehicles in grid-lock traffic go the same, homogenous speed. Additionally, according to the article, the number of vehicles on a given unit road length depends on the length of the vehicle (L) and the “space cushion” a driver keeps from the car in front, or the inter-vehicle gap (IVG). The recommended IVG is around 2–3 seconds at the vehicle speed.
For example, at 120 KPH, this represents 67 m, while at 5 KPH, this represents 2.8 m. For an SUV with a length of 5 m traveling at 5 KPH, the most likely road space (RS) required to operate the vehicle is L + IVG = 7.8 m.
Both IVG and L are independent variables subject to a wide range of values. A vehicle’s length may average from 1.8 m for a sedan, and up to 9.7 m for a large bus. IVGs are independent of the vehicle due to driver behavior and changes in speed due to the vehicle traveling ahead.
In their modeling, Freeman and his colleagues accounted for four classes of vehicle types, including sedans, SUVs, midsized buses, and large buses, and considered speeds from 5 to 40 KPH.
Each vehicle length was assigned its own PERT distribution from vehicle manufacturer data. Using @RISK, the authors ran their stochastic model using 5,000 iterations on each variable at 5, 10, 15, 20, and 40 KPH at the same time, for 1-KM stretch of road. During each iteration, a vehicle class was randomly selected from the four classes for each space.
The vehicle length was then selected based on the class of vehicle. The safe distance was added to the vehicle length by randomly selecting a time spacing and multiplying it by the average speed to get the safe distance.
Rapid Results, Ample Applications
The resulting graphs of the @RISK model yielded a power curve that approximates the expected number of cars at each speed, thus giving researchers a fast, convenient tool for better understanding and estimating vehicle numbers in traffic:
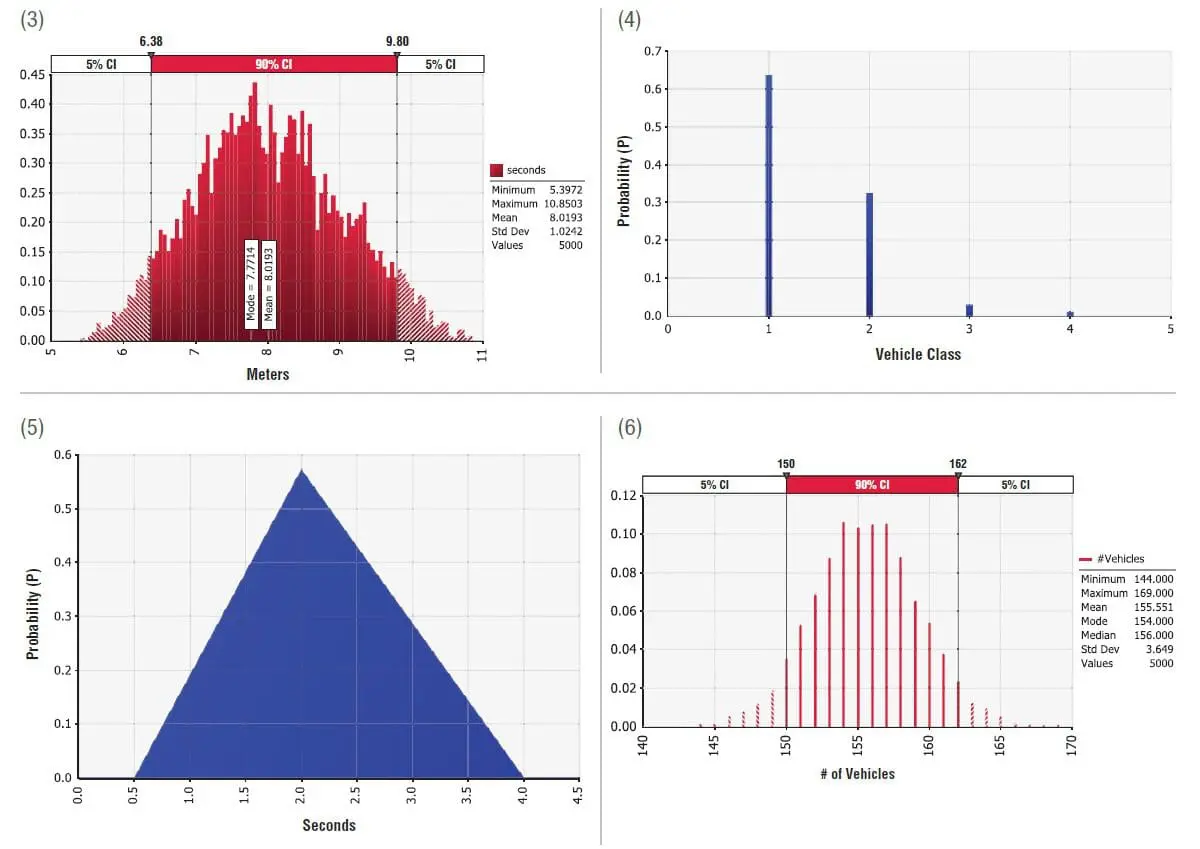
(Figures from EM Magazine) Figure 7. Number of vehicles at different speeds. Figure 8. Number of sedans estimated on 1-km road at 5 KPH. Figure 9. Total mixed vehicles on 1-km road based on average speed. Figure 10. Total number of sedans on 1-km road based on average speed.
"This model has applications for air pollution, civil engineering—even telecommunications,” says Freeman, who explains that people stuck in grid-locked traffic often bide time on their smartphones—which can lead to a surge in the local network bandwidth. For Freeman, the benefit of using @RISK for this research was its efficiency. “You can quickly create a model in Excel that would otherwise require a very complicated statistical tool package to set up,” he says. “You can easily create your model without having to become an expert in statistics."


