



Blogs
Explore insights, tips, and industry trends

Case studies
See how organizations achieve real results

eBooks and reports
Access in-depth research and expert analysis

Research
Discover original research and data-driven insights

Webinars
Join live and on-demand sessions with experts

Whitepapers
Access research and expert analysis

Academy
Build skills with structured courses and training

Certified trainers
Get expert training from certified professionals

International partners
Connect with trusted partners around the world

Knowledge center
Find guides, tutorials, and product documentation




Energy and utilities
Turn energy uncertainty into confident decisions

Trusted by industry leaders across the globe



See the whole portfolio, quantify every uncertainty, and decide with confidence
See the whole portfolio
Bring generation, transmission, distribution, and grid-modernization schedules, risk registers, and budgets into one decision environment. Integrate with SAP, Primavera P6, and Power BI—no system overhaul required.
Replace static dashboards
Give portfolio leaders, risk managers, executives, and regulators one always-current view of the same capital program. Interactive dashboards update live as data changes—replacing manual slide decks and stale reports.
Manage risk across projects
Connect climate, regulatory, and capital risk to strategic objectives. Turn your risk register into a connected model across projects, risks, and the decisions they threaten—so trade-offs are clear and capital allocation is informed.
How energy and utility teams decide with Lumivero
Connect your portfolios in one view
Bring generation, transmission, distribution, and grid-modernization schedules, risk registers, and budgets into one connected view. SharpCloud sits with the tools you already use—SAP, Primavera P6, Microsoft Project, Jira, and Power BI—no rip-and-replace required. Surface cross-program dependencies where hidden risk lives, so one change doesn't ripple through the portfolio unseen.




Surface dependencies and risk across the portfolio
Link climate, regulatory, and capital risk across projects, controls, and strategic objectives—revealing the impact of each risk, not just that it exists. See how a delay in one program affects renewable targets, grid modernization timelines, and regulatory compliance deadlines across the entire portfolio. Risk becomes a connected model, not a disconnected register—so capital trade-offs are clear and decisions are well-informed.
Manage capital-project and program risk
Manage climate, regulatory, and capital risk across the portfolio. Connect your risk register to the strategic objectives it threatens—net-zero commitments, grid-modernization timelines, regulatory compliance deadlines—so you see not just that a risk exists, but what it costs if it happens.


Give every stakeholder a view they can act on
Show portfolio leaders, risk managers, executives, and regulators the same capital program data, in the format each role needs. SharpCloud's role-based dashboards—timelines, grids, network diagrams, heat maps—update live, so every stakeholder sees the same truth without manual slide rework. One model, every perspective.
Plan the energy transition with confidence
Map generation, transmission, and distribution investments to net-zero targets, emissions rules, and regulatory compliance deadlines. See which programs drive which mandates, and where delays create compliance risk across the portfolio.
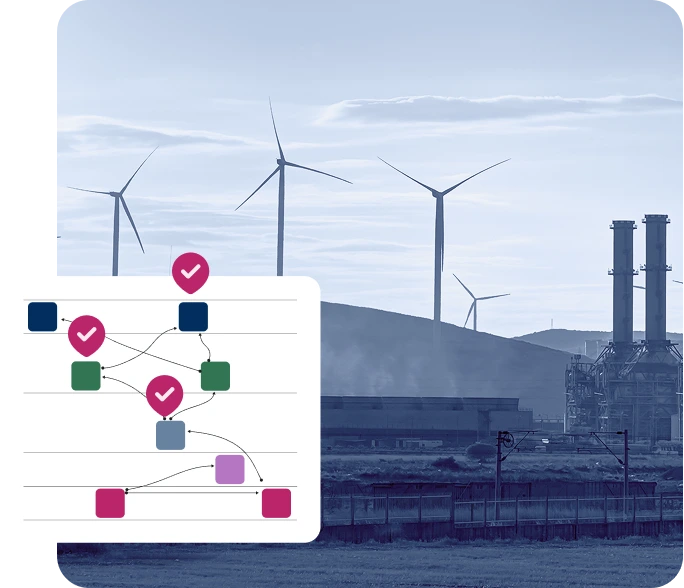
Trusted where the stakes are highest
From grid operators to upstream producers to renewables developers, energy and utility leaders rely on Lumivero to decide under uncertainty.
27,000+
90%
Grid and transmission
Renewables and major infrastructure
Oil and gas
Built for the decisions that keep the grid running

Capital projects and energy transition

Portfolio risk and strategic trade-offs

Regulatory and compliance alignment

Multi-stakeholder decision visibility
Real results across the energy sector

100% portfolio visibility across offshore wind
88 projects. One clear view of the portfolio.

From thousands of hours to a single day
Why energy and utility leaders choose Lumivero
 "Predict! allows us to understand and manage risks across all projects at enterprise level. The integrated quantitative analysis provides vital understanding of cost and delivery confidence."
-
"The ability to model a wide variety of uncertainties and to run Monte Carlo type simulations has given significant insight into what is effectively uncharted waters."
-
"@RISK helps Petrobras reduce the calculation time for projections that used to take thousands of hours to a single day."
Explore research and expert insights about high-stakes energy decisions
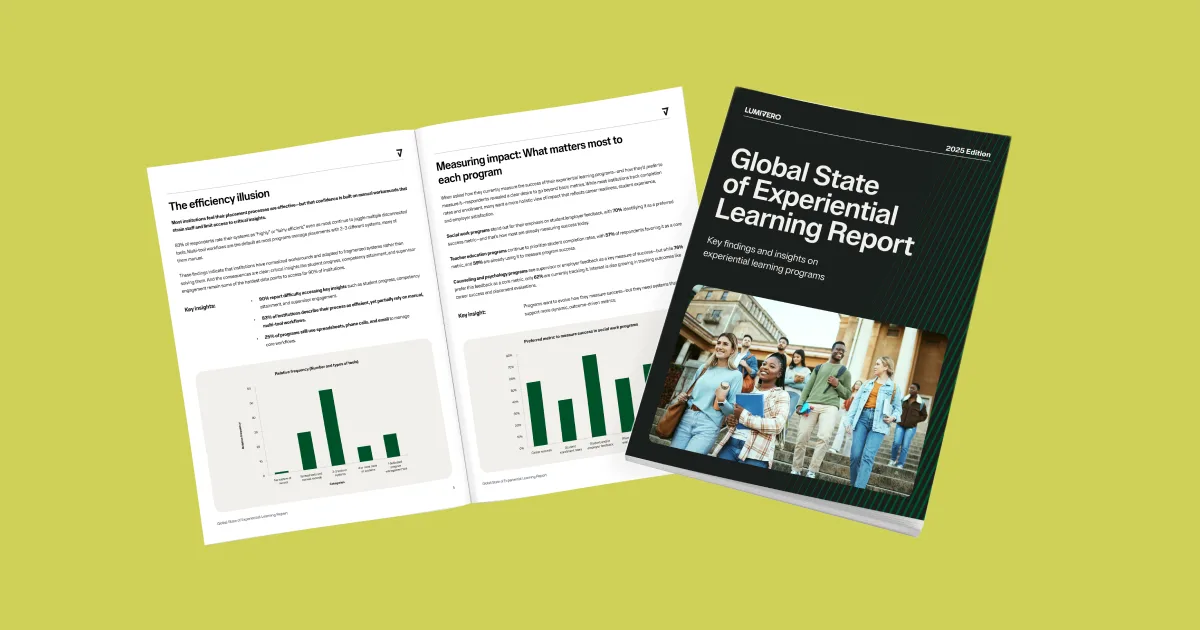
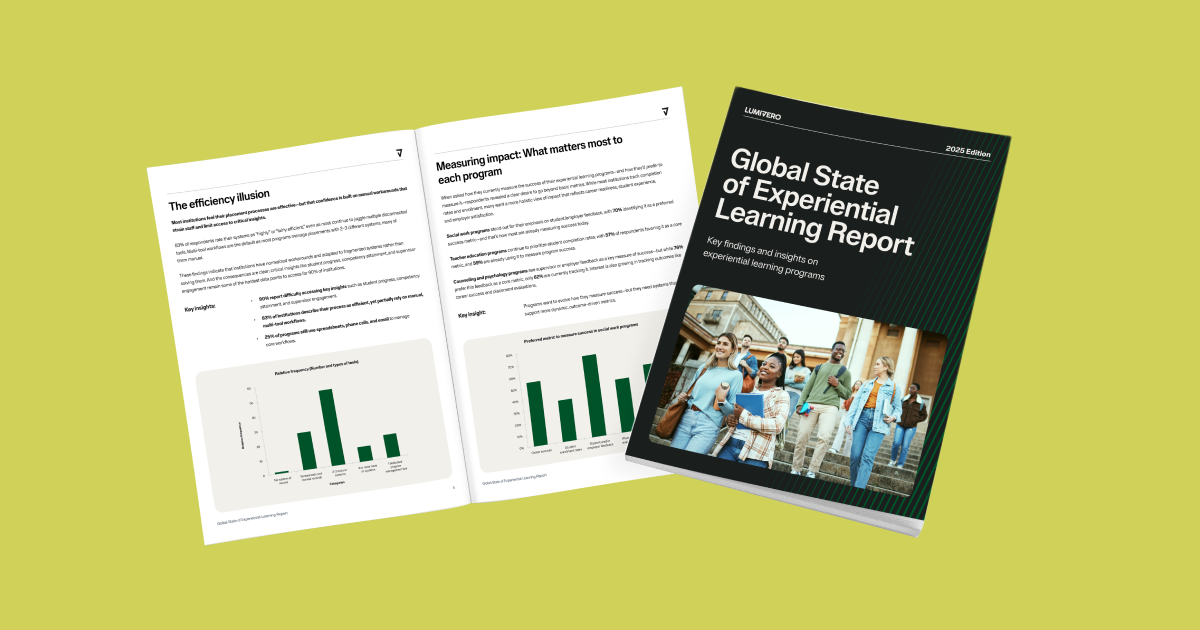
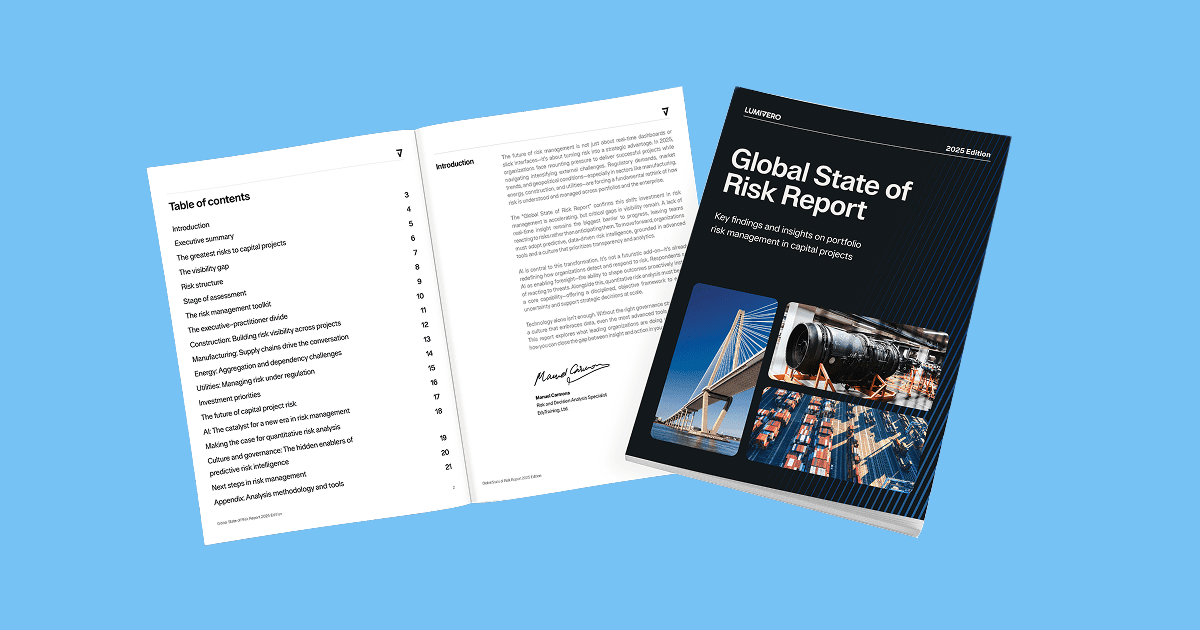 Global State of Risk Report
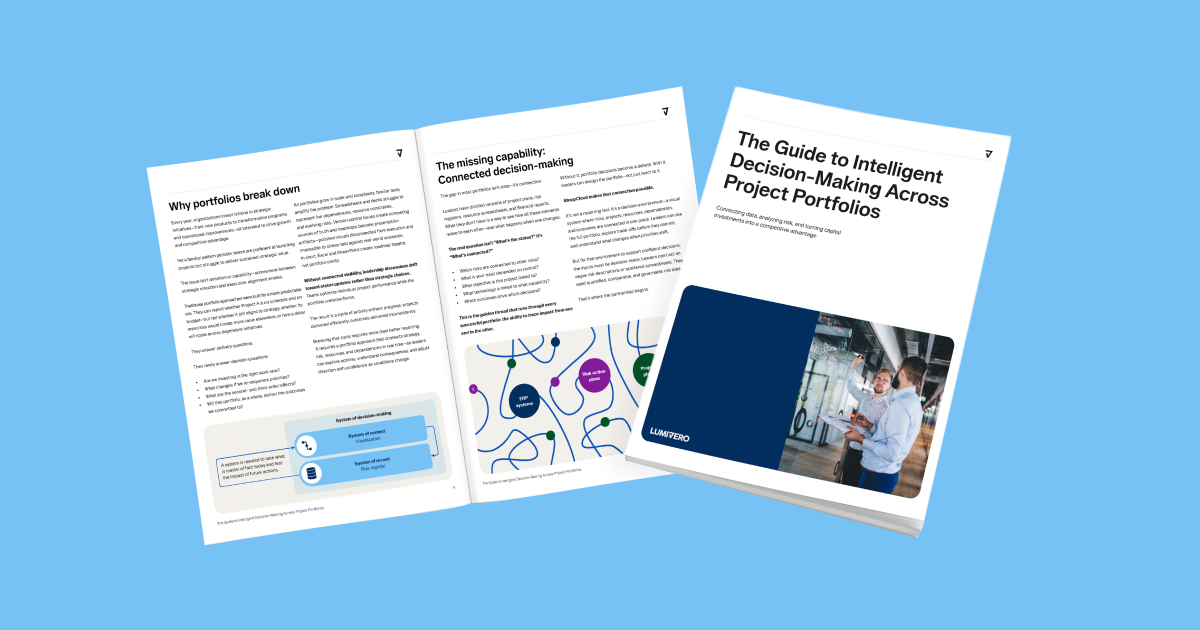 Intelligent Decision-Making Across Project Portfolios Guide
 How Northern Powergrid Unified Complex Program Delivery with SharpCloud

Improve program outcomes, costs, and reliability
See how energy and utilities leaders connect their programs, manage risk, and deliver on time and on budget.
Energy and utility FAQs
Portfolio management software for energy and utilities that connects generation, transmission, distribution, and grid-modernization schedules, risk registers, and budgets into one view. Works with SAP, Primavera P6, Microsoft Project, and Power BI without replacing them.
Energy capital programs span disconnected systems. A delay in a renewable project affects your net-zero timeline, transmission schedule, and regulatory compliance. SharpCloud shows these dependencies and cross-program risk, so capital decisions are backed by the full picture, not fragmented spreadsheets.
Most risk tools keep risk in a static register. SharpCloud connects risk to what it threatens—net-zero targets, transmission timelines, and compliance deadlines. You see which programs drive which mandates and where delays create regulatory exposure across the portfolio.
Yes. SharpCloud shows all three asset classes together. See how transmission delays affect renewable targets. Understand tariff policy impact on capital planning. Evaluate trade-offs across the energy mix instead of managing each in silos.
No. SharpCloud reads from SAP, Primavera P6, Microsoft Project, Jira, Azure DevOps, and Power BI via data connectors.
SharpCloud gives regulators an always-current view of generation, transmission, and distribution capital programs—schedules, risk, compliance alignment, budget. Updates live. No stale monthly reports. One dashboard shows regulatory compliance, program health, and capital risk.
Yes. SharpCloud maps every generation, transmission, and distribution program to emissions rules, compliance deadlines, and net-zero commitments. You see which programs drive which mandates and where you're at risk of missing a requirement. Every team understands why the schedule matters.
Portfolio leaders see schedules and dependencies. Risk managers see risk and controls. Executives see capital trade-offs. Regulators see compliance and program status. Each gets a tailored view updated live as data changes.

How can we help you? Contact us.