






Blogs
Explore insights, tips, and industry trends

Case studies
See how organizations achieve real results

eBooks and reports
Access in-depth research and expert analysis

Research
Discover original research and data-driven insights

Webinars
Join live and on-demand sessions with experts

Whitepapers
Access research and expert analysis

Academy
Build skills with structured courses and training

Certified trainers
Get expert training from certified professionals

International partners
Connect with trusted partners around the world

Knowledge center
Find guides, tutorials, and product documentation





ADVANCED ANALYTICS IN EXCEL
Advanced Statistical Analysis in Excel with StatTools

Analyze Data using a New Statistics Toolset
What is StatTools?


How StatTools Is Used
Forecast demand or products or services, or load on machinery or personnel, using advanced statistical methods.
Get an accurate, data-based forecast of materials and labor costs throughout the entire project.
Gain insight into confidence levels around the risk of equipment failure or safety violations using statistical quality analyses.
Forecast performance of portfolio assets (such as stocks, bonds, real estate, or projects) based on historical data.
Understand future commodities pricing based on historical market data and statistical methods in order to make decisions in oil and gas exploration, construction, and other areas.
Key Features
New statistics in Excel
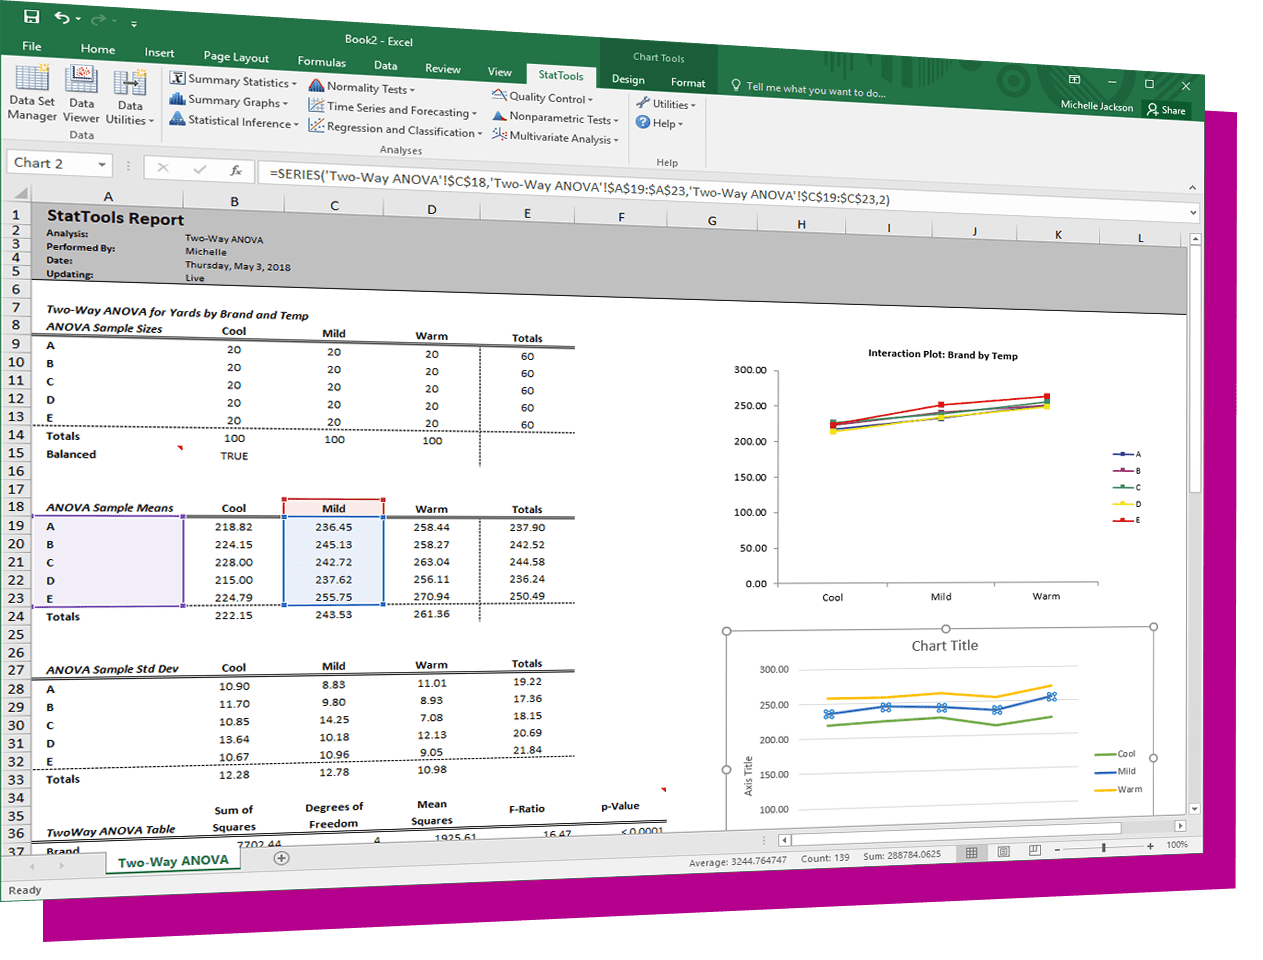
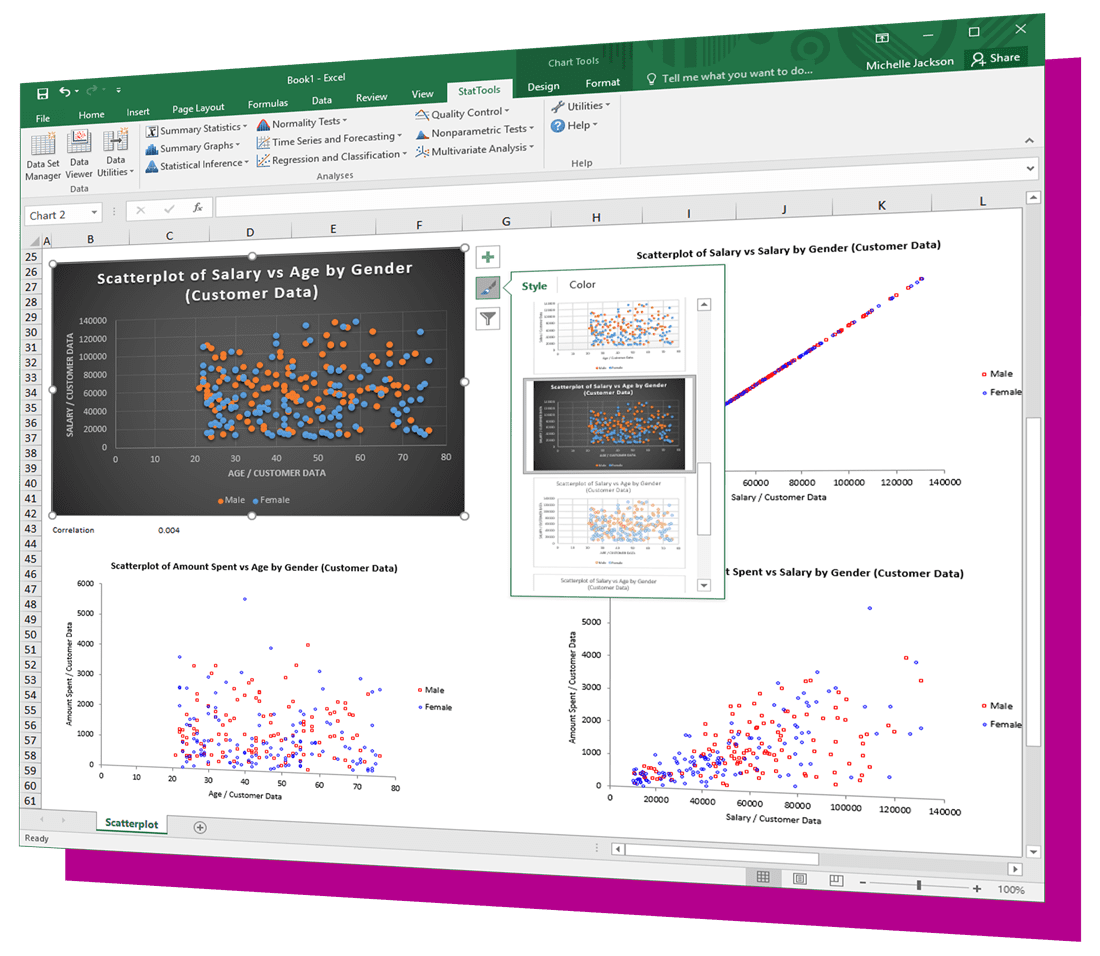
Custom Statistical Procedures
Live Updating When Input Data Changes
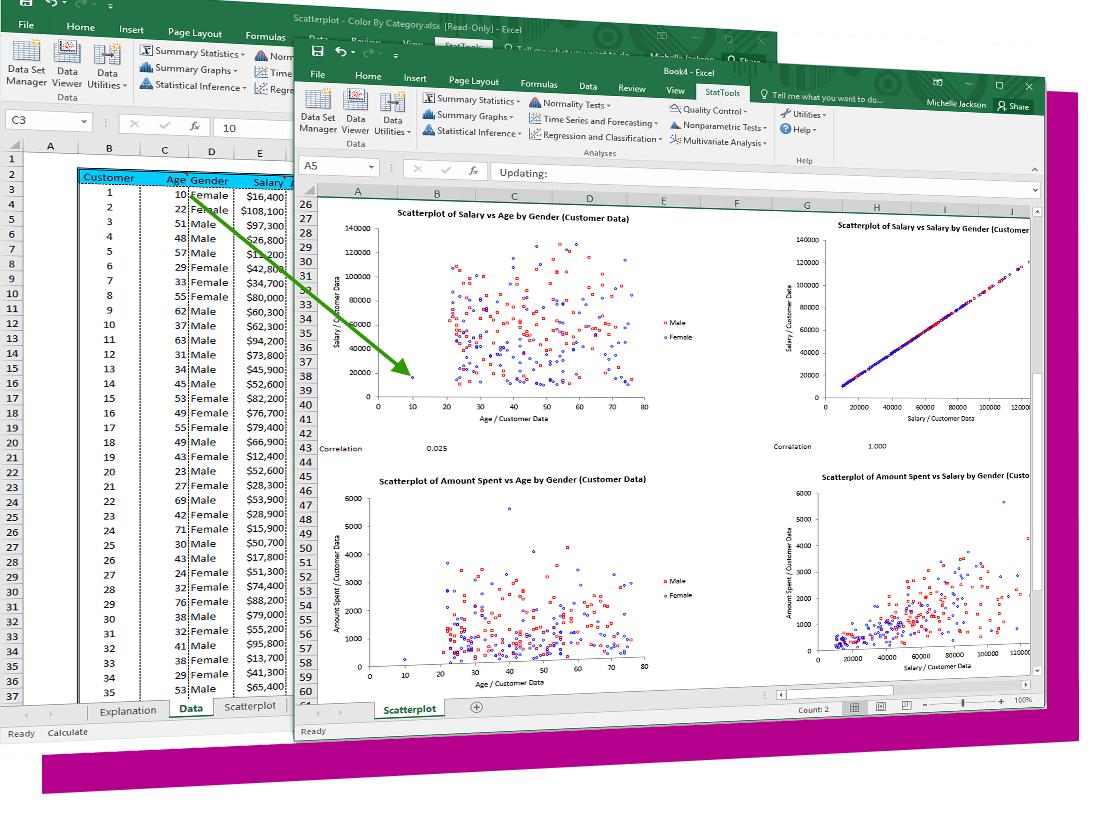
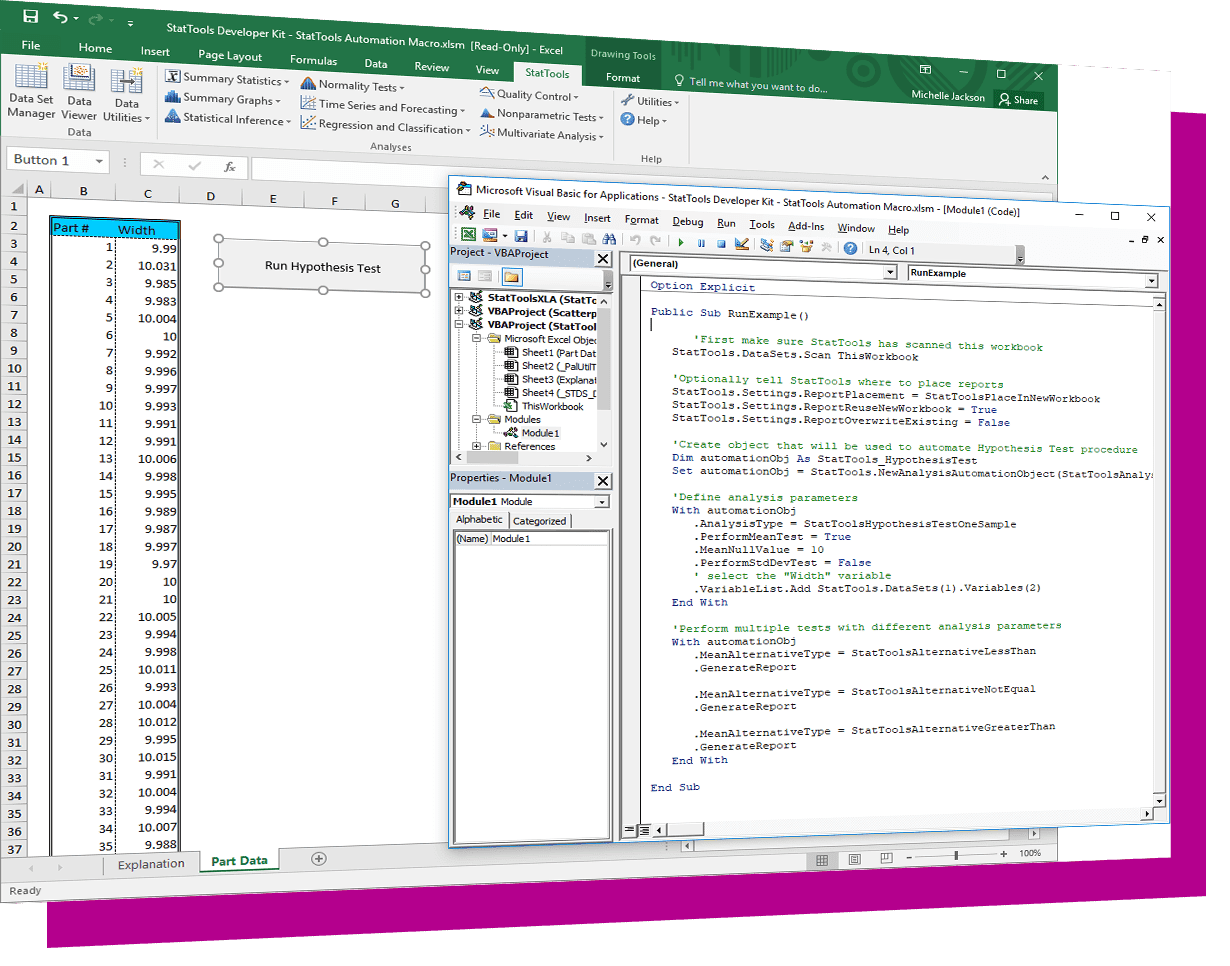
Intelligent Data Management
Capacity For Large Data Sets

Included with The DecisionTools Suite
The complete risk and decision analysis toolkit, including @RISK, PrecisionTree, NeuralTools, StatTools, Evolver, RISKOptimizer, and ScheduleRiskAnalysis.

How can we help you? Contact us.