


The example assumes that the company, “Drugco”, has just successfully completed Phase I and Phase II clinical trials for a new pharmaceutical, “Newdrug”. Drugco must decide if it should proceed with Phase II, which takes two years to complete and requires an investment of $200 million. At completion of Phase III, a filing is made with the FDA, which then takes a year to assess the efficacy of Newdrug in treating the targeted ailment with acceptable levels of side-effects.
If the FDA approves, Drugco can either sell the rights to the drug for a pre-launch exit value of $400 million, or it can launch production by investing $70 million in fixed assets and $30 million in net working capital.
Clearly there is a great deal of uncertainty facing this hypothetical company, making it a perfect problem for @RISK to analyze. In this case, decision-makers are most concerned with two ultimate outcomes: Net Present Value (NPV) and Internal Rate of Return (IRR). For this model, these are the two outputs that matter.
There are several inputs influencing these outputs, including:
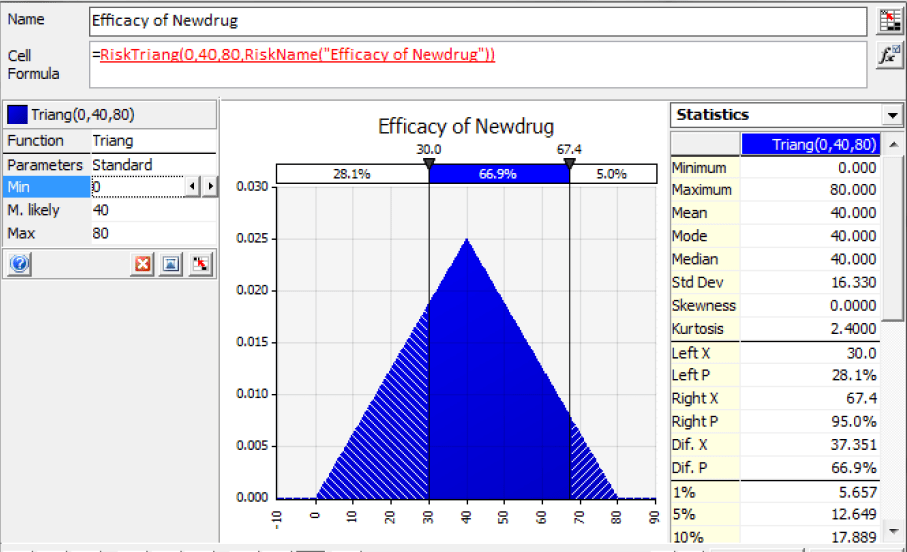
1) Drug Efficacy: This is necessary for FDA approval. The minimum efficacy level required for FDA approval is 30. In the example model, Newdrug’s efficacy has a triangular distribution with a minimum value of 0, a most likely value of 40, and a maximum value of 80 (Figure 1). The model also assumes the existence of a competing, alternative drug, which is an improved version of an already-approved drug currently used in major research hospitals. This competing drug has a triangular efficacy distribution of with a minimum value of 50, a most likely value of 50, and a maximum value of 100. Thus, there is a chance that Newdrug will fail, and the competitor will almost surely to obtain approval.
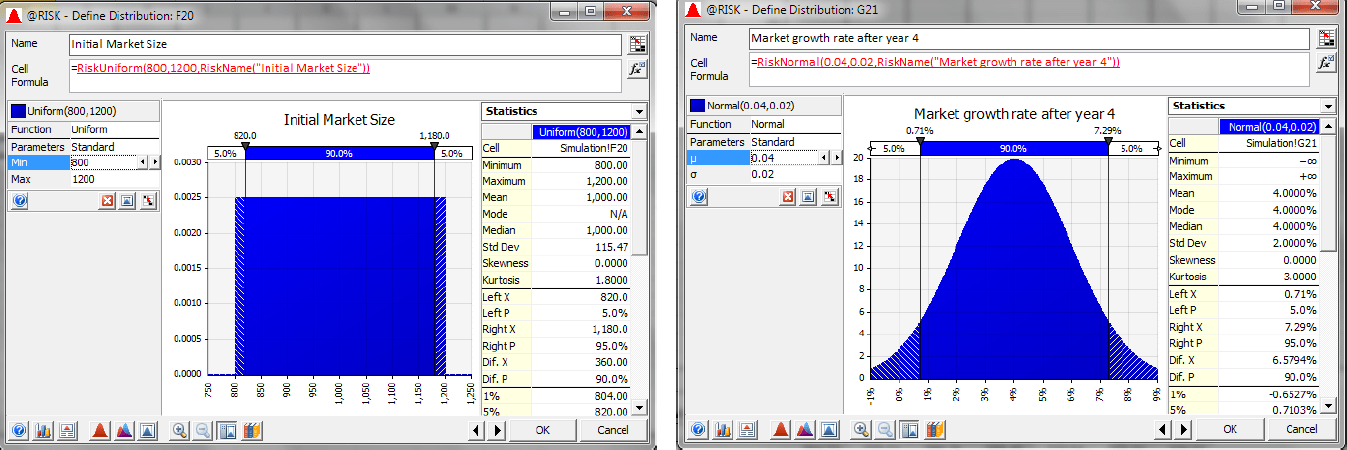
2) Market Size and Market Growth: After the three-year development and approval process of Newdrug, it can be manufactured in year four. However, what the market size will be in four years is unknown. Therefore, a uniform distribution is assumed with a minimum value of 800 million doses and a maximum value of 1200 million doses, with doses priced at $1—meaning a one billion dollar market on average. The model also assumes that the market will grow at a rate that is normally distributed with a mean of 4% and a standard deviation of 2%.
3) Initial and Subsequent Market Share: Without FDA approval, market share is zero. If Newdrug receives FDA approval, its initial market share depends on its efficacy and the efficacy of the alternative drug. In subsequent periods, the introduction of new alternative drugs can erode Newdrug’s market share. Dr. Joaquin’s model assumed that subsequent market share of Newdrug is equal to the initial market share divided by the cumulative total number of alternative drugs in the market. Initially, the number of alternative drugs is equal to one. However, each year thereafter, there is 10% probability that a new FDA approved drug will be introduced. The arrival of a new alternative drug is represented by a Bernoulli variable which assumes a value of one 10% of the time, and zero otherwise.
4) Initial and Subsequent Cost of Goods Sold to Sales Ratio: Dr. Joaquin’s model assumes that the initial ratio of cost of goods sold to sales follows the triangular distribution with a minimum value of 0.10, a most likely value of 0.30 and a maximum value of 0.30. During the first year of operation, the most likely value is equal to the worst plausible (maximum) value of 0.30. Over time, the distribution evolves, with the most likely value being equal to the realized value in the previous period, and the minimum and the maximum value remaining the same as that of the initial distribution.
5) Terminal EBITDA: To simplify the analysis, we assume that the terminal value at the end of 10 years is equal to final EBITDA value multiplied by a random EBITDA multiple which follows a triangular distribution with a minimum value of 0.50, a most likely value of 1.00, and a maximum value of 2.0.
Dr. Domingo Joaquin
Illinois State University
@RISK’s Results
After running the simulation for 10,000 iterations, @RISK provides histograms that give visual representations of the different NPV and IRR outcomes and their probabilities (Figure 3). For example, the graphs show that there is 28.6% probability of the NPV exceeding $400 million. This corresponds to the probability that Drugco will launch the Newdrug line, as opposed to abandoning the project because of failure to obtain FDA approval or selling the rights to the compound for $400 million.

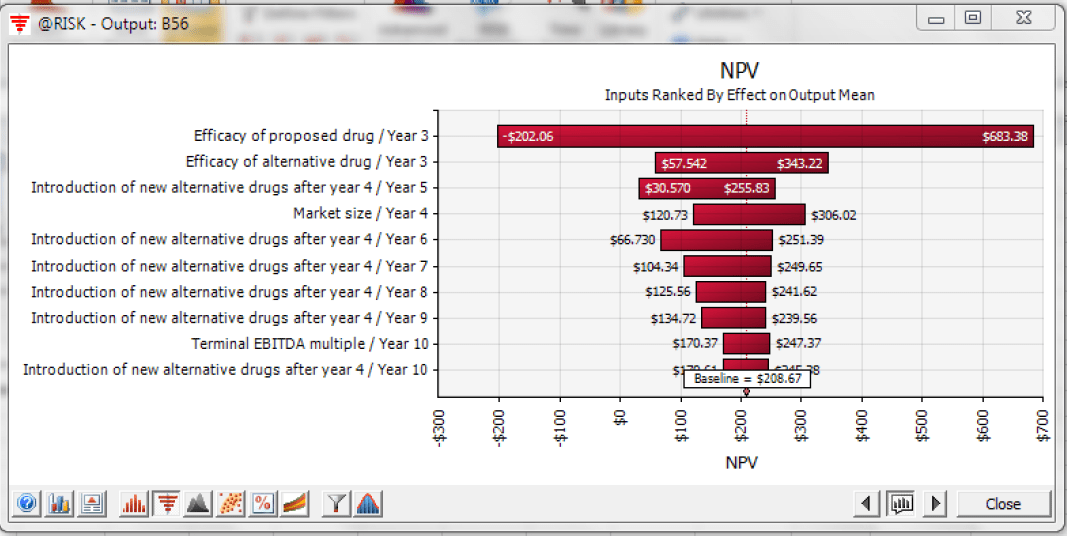
Tornado charts also provide valuable insight to the most influential inputs (Figure 4). In Dr. Joaquin’s example, the most important input is the efficacy of Newdrug and that of the alternative drug. “Realized efficacy can make or break the project,” says Joaquin. Project success hinges how high Newdrug’s efficacy is relative to FDA standard so Drugco can be permitted to launch the product and also on how high it is relative to that of the alternative drug so Newdrug can secure a comfortable initial market share. Because of the immediate impact on market share, the introduction of new alternative drugs in the early years also has more impact on NPV than those introduced in the later years. This is to be expected because, in addition to time value of money considerations, the effect of change in market share in the earlier periods extends over a longer period of time.
Dr. Joaquin uses @RISK in his classes to teach examples like the one described above, as well as many others. He prefers @RISK over other competing products due to its versatility and power, and relies on the software because “it makes the process of simulation very easy to do, as opposed to having to start the simulation using Excel.”
Related paper: Joaquin, Domingo C. and Kang, Han Bin, Using Simulation to Support the R&D Decision of a Pharmaceutical Firm (June 29, 2014).


