


ENGCOMP is a Saskatchewan-based structural, mechanical and cost engineering consulting firm. Catering to Canada's commercial and heavy industrial market, it provides engineering services to the potash, uranium, oil and gas, pulp and paper, chemical processing, and food processing industries in Saskatchewan and Alberta.
With structural engineering as its core business, ENGCOMP also specialises in risk analysis, cost estimation, planning and computer task automation.
ENGCOMP was contracted to assist the Canadian Department of National Defence (DND) to define the budget for the fourth phase of construction of its ongoing Fleet Maintenance Facility Cape Breton (FMF CB) project located at the Canadian Forces Base Esquimalt, Victoria, BC. Using @RISK, ENGCOMP conducted Monte Carlo simulations to quantify the uncertainty in defining the budget and schedule for this project.
Project status
The FMF CB project has been ongoing for more than 10 years. DND was looking to consolidate and upgrade the FMF, which includes smaller facilities, spread all over Base Esquimalt’s Dockyard area, into one large facility. To do this, DND needed to evaluate its remaining budget and existing schedule to complete the fourth phase of construction.
Whilst risk assessments had been conducted on the project in the past, a true risk analysis using Monte Carlo simulation had yet to be completed. Monte Carlo simulation, a quantitative statistical modelling tool, is important to this project as it can help reduce budget uncertainty and greatly increase the likelihood of achieving project success.
Jason Mewis, President, ENGCOMP, says, “Risk analysis is crucial to the cost and schedule management of any project, and must include a scientific approach to contingency and risk reserve estimation. As a concept, Monte Carlo simulation has been around for a long time, but is not widely used, and where it is used it is primarily applied to just capital cost estimation. A Monte Carlo-based simulation tool such as @RISK can help reduce uncertainty, greatly increasing the chances of project success.”
ENGCOMP developed a system that breaks down the Monte Carlo simulation into two – a simulation for Contingency Analysis and one for Project Risk Analysis.
Using @RISK to define the contingency budget
Contingency is a very important aspect of budgeting and needs to be accounted for properly to ensure project success. It is the amount of money that needs to be added to a project budget to account for all the expected construction costs that haven’t been itemised at the time of budgeting.
As the first component of its Monte Carlo simulation-based risk analysis, ENGCOMP needed to determine the amount of contingency that would be required to be applied to the project budget, with a reasonable level of confidence, that the final approved budget for the FMF CB project would not be exceeded. Using @RISK, ENGCOMP aimed to quantify the potential variability of factors such as labour rates, material and equipment costs and productivity, to ascertain the amount of contingency that should be allocated to the overall project budget.
ENGCOMP assessed the contribution of the various work packages in the cost estimate to determine the total contingency required for the project. A work package represents a collection of work actions necessary to create a specific result. It is typically defined by statements of activity description, activity resources of skill and expertise, estimates of activity duration, activity schedule and activity risks.
ENGCOMP used @RISK to calculate the total project cost, both with and without estimated variability on the work packages. The difference between the two totals yielded the contingency for the project.
The results of the @RISK Monte Carlo simulation for the contingency analysis showed that the bulk of the budget uncertainty was due to market volatility and unknown site conditions. Existing FMF functions are located in facilities that were used for industrial functions that historically were relatively unregulated. Site investigations indicated potential contamination below these old structures. However, the requirement to maintain ongoing operations precluded the option of removing the buildings to conduct the comprehensive testing necessary to establish definitively the nature and extent of contamination and the related costs for removal and disposal. Therefore, the DND needed to assign significant contingency budget towards the demolition and decontamination activity.
Jason Mewis
President, ENGCOMP
Using @RISK to model risk to quantify risk reserve and project schedule contingency
The aim of the Project Risk Analysis was to take the Contingency Analysis to the next level, quantifying the effects of all reasonable risks and uncertainties on the project.
This component of the @RISK Monte Carlo simulation accounted for those items that are not required to construct the project, but should they occur, then DND would be expected to pay for them under the cost of the project. These factors included market conditions, environmental issues, internal operational issues and organisational changes that could collectively impact on the successful completion of the FMF CB project. For instance, the @RISK simulation aimed to quantify the uncertainty posed by unforeseen developments such as weather conditions preventing construction, labour strikes, delays in environmental approval, labour shortages, currency fluctuations, and safety, to name a few. Such occurrences can affect both the project’s cost and schedule.
@RISK enabled ENGCOMP to estimate the impact of the variability and uncertainties pertaining to risks, costs and scheduling. This assessment enabled them to estimate the project risk budget as well as the Risk Reserve and Schedule Contingency.
A key finding of the Project Risk Analysis was that, taking into account all the risk and uncertainties on the project, there is an 85 percent certainty that the FMF CB project will be completed by January 2014.
Project secures approval from Federal Government’s Treasury Board, despite high level of cost uncertainty
Canada’s DND operates infrastructure projects under highly regulated and controlled regime, as one might expect given the nature of the organisation. This means that securing project funding approval in a timely fashion represented a huge challenge for DND. For the FMF CB consolidation project, this challenge was further compounded as there were numerous other organisational and technical problems. Therefore, establishing and presenting the budget in a manner that would confidently demonstrate its successful completion was imperative.
Mewis explains, “We were able to help the DND define the budget as well as give them the tools to defend it. Based on our quantitative risk analysis, DND was able to clearly justify to the Federal Government’s Treasury Board why it should be allowed to get the capital appropriation for the project despite the level of uncertainty. This may not have been possible without the detailed and comprehensive analysis enabled by @RISK.”
The FMF CB project has been authorised and is in progress. In addition, due to the success of the risk analysis undertaken by ENGCOMP, DND is talking with the company about possibly preparing a policy on performing this level of detailed Monte Carlo simulation-based analysis for all future DND projects.
Additional Information
Distributions used Predominantly, ENGCOMP used the Trigen function, which enabled them to account for the inherent error relating to the subjective estimation of uncertainty. They used a structured calibration training process for all the analyses so that the ‘Subject Matter Experts’ (SME’s) could be as “good” as possible at estimating uncertainty. Also, as sometimes groups cannot be fully calibrated, the process highlighted to what degree the team was calibrated, giving ENGCOMP the ability to adjust the estimated values to reflect the appropriate level of confidence.
There were cases where ENGCOMP used a Pert distribution if there was a lot of skew towards a particular parameter in the estimated distribution. This helped smooth out the Triangular distribution and put less emphasis on the tails in the analysis.
Graphs
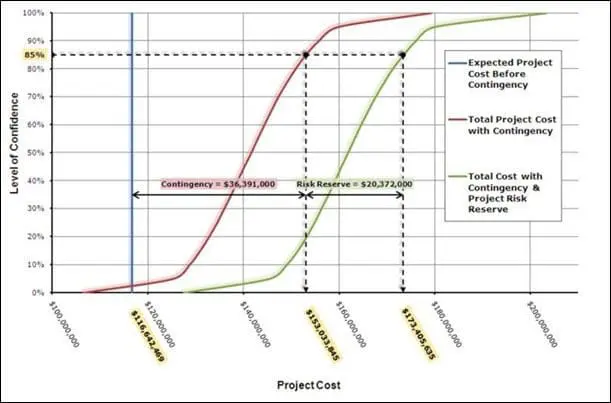
Graph 1: ENGCOMP's Risk Induced Second S-Curve Diagram
This graph is used to clearly distinguish between the varying levels of cost uncertainty encountered on the project.
The blue line represents the base total cost estimate. The red S-curve is derived from the Contingency Analysis process and represents the variability in the cost estimate for the project. The difference between the blue line and the red S-curve is the ‘contingency’ cost that needs to be applied to the total project cost.
The green S-curve represents the results of the Project Risk Analysis (PRA), which adds the impact of schedule uncertainty and outside risk factors to the total project cost with contingency. At any given level of confidence, the difference between the two curves is the Risk Reserve budget.
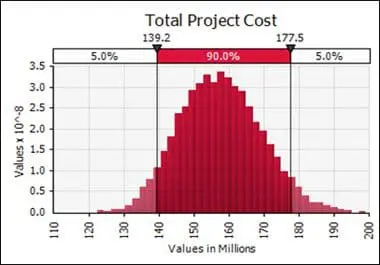
Graph 2: Histogram for the Total Project Cost
This graph represents the population of data that was generated during the analysis and gives the general shape of the data distribution. It depicts the total project cost including the contingency budget.
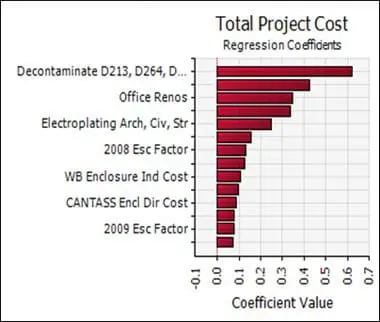
Graph 3: The Tornado Graph
This graph represents the sensitivity analysis done within each simulation. It displays the the cost drivers that have the most impact on the bottom line and how they correlate to the total cost. The longer the bar, the larger the impact it has on the bottom line if it varies. This graph shows that the decontanmination activity induces the most uncertainty in the estimation of the total project cost.


