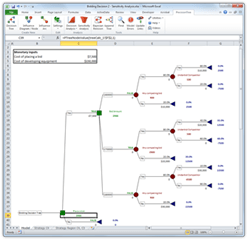
This is a continuation of Part I in this series on Decision Tree Analysis.
Life is full of tough choices. Most of us muddle through them using best guesses and gut feelings. But have you ever wondered if there might be a more sophisticated way to make decisions? Many businesses, researchers, and organizations have asked the same question, and turned to decision tree analysis.

Decision trees are quantitative diagrams with nodes and branches representing different possible decision paths and chance events. This helps you identify and calculate the value of all possible alternatives, so you can choose the best option with confidence. This technique applies to almost any industry and field; it can help oil companies determine optimal testing and drilling strategies, help medical researchers determine the best tests and procedures to maximize a patient's recovery, or help a law firm decide on the best litigation strategy in a legal dispute.
How does this tool work? Decision trees let you visually map out complex, multi-layered decisions in a sequential, organized manner. This helps you identify all possible alternatives and choose the best option. This formal structure represents decisions and chance events that are linked in sequence from left to right. Decisions, chance events, and end results are represented by nodes and connected by branches. The result is a tree structure with the "root" on the left and various payoffs on the right. Probabilities of events occurring and payoffs for events and decisions are added to each node in the tree.
PrecisionTree software creates decision trees and influence diagrams in Mircosoft Excel, allowing you to identify all possible alternatives and choose the best option.
Start exploring PrecisionTree with our free 15-day trial of DecisionTools Suite.

