


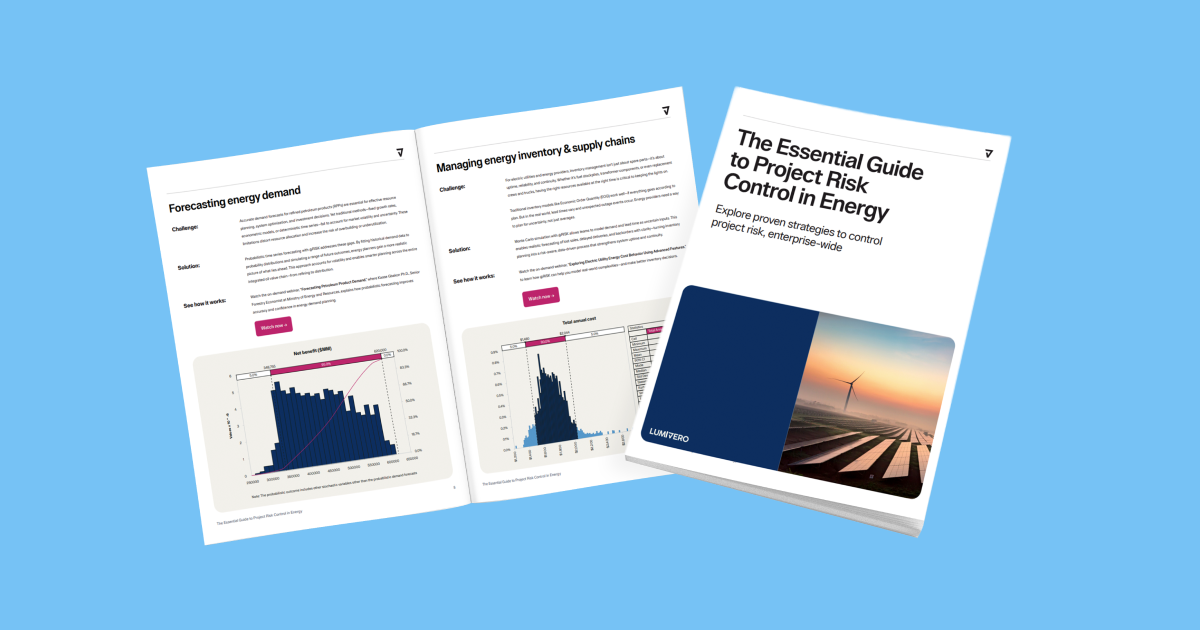


From sentiment analysis to statistical significance, this example case study shows the power of NVivo with XLSTAT.
Survey data often contains a wealth of valuable information, but pulling it apart to get to the core insights can be a sizable challenge. Regardless of the type of survey data or the industry sector you’re in, using both statistical software and software for qualitative research data analysis can help you uncover hidden insights in your qualitative data.
In this fictional case study, NVivo, the industry-leading qualitative data analysis software (QDA software), is used in tandem with XLSTAT, an advanced statistical software, to analyze employee satisfaction survey data results in the human resources sector.
Introduction
Meet Emily, Head of Human Resources at Aviation Engineering (AE). AE has always had a reputation for being a great place to work. However, lately there has been an increase in the number of resignations from some talented staff. Emily wants to get to the bottom of what is going on. She talked to a few long-time members of staff, and they seemed very happy with AE and its culture. So, she thought she needed to find a way to dig deeper. Enter Lumivero’s powerful QDA software and statistical software.
Survey Design and Data Collection
Emily designed a simple survey which asked one open-ended question: Could you please describe in detail your feelings about your job and what aspects contribute to your satisfaction or dissatisfaction in your role as an aircraft engineer?
She also collected data about their age and income.
Initial Analysis: Sentiment and Word Cloud
Emily's first thought was to do a sentiment analysis of the responses to the question. The results showed a striking difference between younger and older respondents.

But that didn’t get to the ‘why’ employees were happy or unhappy with their job. A word cloud gave some clues: the word passion was mentioned, but so were stress, dream, and pressure.


Digging Deeper with NVivo
Emily needed to dig deeper into the survey data, and with QDA software like NVivo, she could tag participants’ responses. The word cloud above gave clues on the themes discussed. Emily could automatically code from the word cloud for stress, pressure, and innovation, but she went through the question carefully to pull out some more themes. Once she did that, she ran a crosstab to see theme by age. Emily was able to use this interactive chart to pull out quotes to be used for her report as shown in the following video.
Emily could immediately see that there was a huge difference in how the older employees saw their work compared to the younger employees.
Employee Perspectives
Older employees valued the opportunity to be creative and innovative, as illustrated by the following quotes:
"As a plane engineer, I experience the perfect blend of creativity and precision. It's a world where dreams take flight, and I'm soaring with them every day!"
"Aircraft engineering is where science meets imagination. Building planes allows me to explore both worlds, and it's the most fulfilling job I could ever ask for."
Whereas younger employees felt stressed and under constant pressure.
"Being a plane engineer is a constant struggle. Endless pressure, long hours, and no time for personal life make it unbearable."
"The constant pressure and the feeling of being undervalued have turned my once-loved job as a plane engineer into a daily struggle."
Statistical Analysis: Age and Job Satisfaction
Emily felt she was uncovering some important insights, but to convince the executive team, she wanted to check how significant were the findings. Fortunately, it was easy to export her data out of NVivo to XLSTAT for statistical analysis.

The average of the results of the sentiment analysis was equal to 0.10 which means that people are neither happy nor unhappy. Previously, Emily only looked at the average sentiment. The insights in NVivo revealed a striking difference between the older and younger employees.
To test how significant this was, she performed an ANOVA using XLSTAT. The result was clear: age has a highly significant effect (p value < 0.0001), with older (41-60) people happier in their work than younger people (23-40). So, the simple average was actually hiding real insights with the presence of two groups!


The Impact of Income
Emily wondered whether income had an impact on employees’ satisfaction. While employees generally earn more with seniority, recently, to attract talent and to counter the recent trend in resignations, higher salaries were being offered to younger employees.

Emily saw that if she compared wages with age, a relationship is significant (correlation = 0.323; p value < 0.0001), but still low (correlation range is between 0 and 1). However, when she looked in more detail at those younger employees that earn more money, she saw in the following graph that they were still unhappy. So, a higher salary does not necessarily lead to a higher level of job satisfaction for young people and giving them more money will not resolve the retention problem.

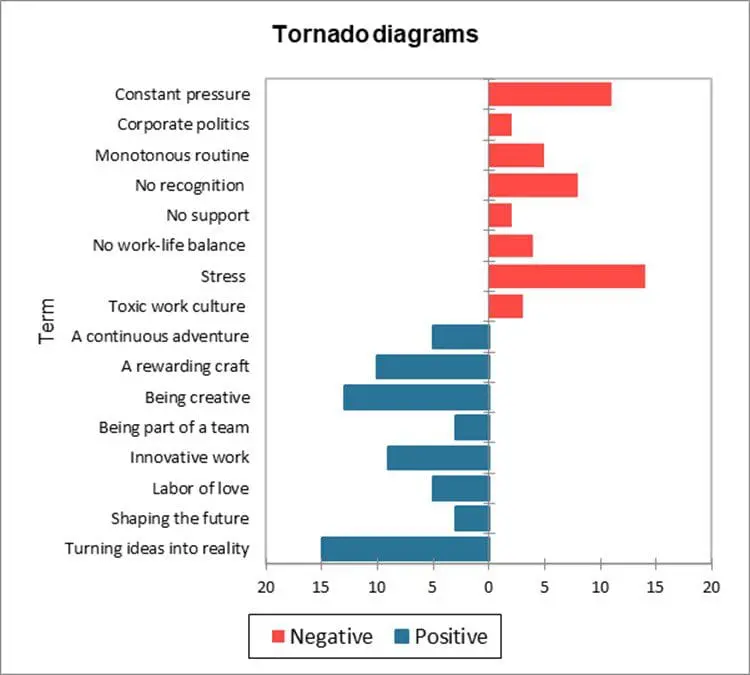
In addition, to understand the reasons why respondents liked or disliked their job, Emily needed to present the statistical results through a tornado diagram (available in the XLSTAT back-to-back histogram feature). This diagram allow her not only to see the positive and negative themes, but also to compare their importance. Turning ideas into reality is the theme with the highest positive scores, while stress is the most negative theme.
Conclusion

Thanks to the combination of NVivo and XLSTAT analyses, Emily now has a clearer understanding of AE’s workforce. Offering higher salaries to new, younger employees will not impact retention. Instead, she will be focusing on looking at ways of relieving the pressure at work and building up the younger employees’ original joy in their work.
To learn more about how to quantify your qualitative data, check out our article How to Quantify Qualitative Data: What is the Significance of Your Data?
Free Demo of NVivo and XLSTAT
See how you can start uncovering deeper insights from your survey data by requesting a free demo of NVivo and a free trial of XLSTAT today!


