


NVivo allows you to create diagrams from your data - a picture emerges of different categories and nodes and how they relate to each other.
Coding queries give you insight into the sort of data you have so that you begin to understand what may be worthy of further examination. Matrix coding queries then allow you to compare and, as will become clearer, to contrast data.
If you haven't yet used NVivo's Coding queries or Matrix Coding queries, I would recommend the tutorial Explore your coding - it gives you a practical demonstration in just eight minutes.
Asking questions
In this post I want to show you how a variety of questions can be drawn out of your NVivo data and then analyzed with comparative simplicity.
The sort of questions that I, as a researcher, want to know are:
- When I consider interviews, surveys and focus group data, are my results representative of a significant majority or just the loudest and most articulate of the respondents?
- Are there meaningful relationships between categories of data?
- Are there significant differences between categories of data?
- Is there a discernible pattern of events over time?
Three more general points will emerge from this. Firstly, for those with some memory of qualitative (or nominal) statistics, 'Chi Squared' is not the only fruit! Secondly, statistical tests will not reduce you to a slave of the machine; both in category selection and understanding the results of the tests, your judgement is as vital as it was when you created the questions or posed them in a particular way. Thirdly, your qualitative analyses using NVivo will make quantitative analyses safer: they will help you form a rationale before going off and pressing a set of buttons!
Exploring relationships
Let’s take the sample project that comes with NVivo - 'Environmental Change Down East' (see the video to see how to get to this).
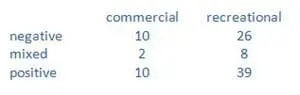
This set of data comes from running a Matrix Coding query using the sample project:
![]()
The number of comments made about water quality have been cross-tabulated, according to two factors:
- demographics (type of fisher folk)
- categorised attitudes to water quality (+, -, ?).
But couldn’t the proportion of comments be influenced by the vociferousness of some respondents? Mr Crucial may be the offspring of Mrs Well-Connected and her famous husband Mr Angry.
Instead of studying the number of comments, NVivo allows you to switch easily to the number of people expressing these attitudes (see the video). So our test studies a sample of people within a population. Let’s stick with this measurement criterion:
![]()
Now (again shown in the video), you can also examine the relationships by creating a chart in NVivo:

Testing for significant relationships
We can then transfer our data to software such as SPSS or StatsDirect (do note that in SPSS, when you input summary data as above, as opposed to raw data, you must use ‘weight cases’, selecting the number, or frequency, variable).

Let us subject the numbers on the left to a test, the Chi Square test of association. The test tells you whether or not there is likely to be a relationship between the two factors, fishing demographic and attitude to water quality.
The result is non-significant.
We should accept the hypothesis that there is no proven relationship. However, you may decide to remove the ‘mixed’ attitudes: the numbers are small (hence inappropriate for this test, which requires a minimum of five in any category, although a Fisher test is allowable) and more to the point, you don’t see the point in keeping these responses. So, then we do a 2 by 2 Chi Square test of association using the data on the right. In this case, the result is again insignificant.
Example of a significant relationship
Here is an example from one of my books, where we concern ourselves with the relationship between having seen a promotion relating to a social or environmental issue and being concerned about it.
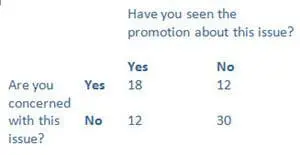
In this case, the relationship is significant. We can ‘reject the null hypothesis’ which says that our results are chance or effects of extraneous factors. However, while we can be quite confident that a relationship exists, correlation does not prove causation: the promotion may have raised awareness, but alternatively, worried people may be more likely to look out for materials which confirm their fears. Which brings you back to your qualitative analyses (and perhaps further quanting later?).
The possibilities for analyses are endless. The relationship between gender and attitudes to a policy or product; a disability and educational preference; the presence of a chemical substance and the incidence of a disease; etc.
Determining a significant difference
Let us return to our NVivo example.
We may decide to dig deeper.
People in commercial fishing are divided on the issue; we will not test the left-hand figures, as this is clearly 50-50. However, recreational fisher folk seem very positive. However, can we say that there is a significant difference? That as a sample of the recreational fishing population, they represent their population in being clearly positive?
We could examine the differences in responses by using the Chi Square of goodness of fit test. Subjected to this test, our figures of 26, 8 and 39 give us a clearly significant difference. However, this test does not tell us that a particular number has dominance, merely that there are significant differences between the numbers involved; in other words, we can reject a ‘non-preference’ hypothesis.
To examine further, we will need to chop our data further, into a choice of two numbers (a dichotomy). Before we move to this, I would just like to suggest other uses of this test: incidences of botulism related to different foods being consumed; different product choices; differences in pine tree population dependent on soil type. In each case, we are able to see if there are significant differences arising from a factor, but nothing more specific.
Exercising qualitative judgement
By the way – although not coincidentally – why don’t we run lots of these tests just to see what is significant and what isn’t? Well, each test gives you a result which roughly says, there is only (for example) a two in a hundred chance of this test being a fluke (p < .02 – yes, the famous ‘p value’). It stands to reason, as Alf Garnett wouldn’t have said on this occasion, that if you run a whole lot of tests, then your chances greatly increase of producing a fluke result, that your result could in fact be one of those two in a hundred fluke results.
And remember the gambler’s fallacy. Believe it or not, what came before does not affect what happens next. So you never know when you are going to get a fluke, or how often it will happen. Clearly, however, the more tests you run for the fun of it, the more likely it is that a chance result will occur. So instead of just examining any old result (‘dredging’), you should be exercising your qualitative judgement about what is important and thus needs testing. It is your duty to avoid mathematical artefacts, not the computer’s!
Other ways to test for significant differences
Having jettisoned the ‘Mixed’ results, let us see if there is a significant difference between these two strands of opinion. In other words, is there a significant majority of recreational fisher folk who are positive about the water quality?
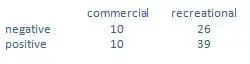
Here you would use either the binomial test or the sign test. In either test, a non-significant result would arise here. (If the test result is narrowly ‘insignificant’, it does not mean that there is no effect, just no clear evidence that chance can be ruled out.)
Other examples might be a policy choice or preference for a product. If in any of these examples, we contrasted the numbers 67 and 33 (out of a sample of 100), we would get a clearly significant result.
Testing 'before and after' scenarios
The tests used in the previous section are for uncorrelated results. Where there is a relationship between the two responses, typically in a ‘before and after’ scenario, we need a different test, the McNemar.
Examples would be respondents’ attitudes to a policy before and after seeing a documentary, presentation or event; whether or not certain symptoms are manifest both before and after a drug has been taken; are certain characteristics to be seen both in children aged 8 and adults aged 18?
Analyzing a set of events (aka survival analysis)
I mention survival analysis in parentheses, because in spite of the most common name for this type of analysis, the events in question are not necessarily medical or even negative. Events can be as diverse as promotions, the disappearance of symptoms, the breakdown of hardware or software, organisational meltdowns, marriages or divorces, graduation or dropping out.
Here two things are required: an event and when it happened. Although this needs to be a string of events, so it is probably not going to be drawn from interviews or a focus group. However, you might start with discoveries from such sources, which may emerge from NVivo Coding queries. This might stimulate you to find a more reliable source, such as a health and safety record book or HR records. Armed with a set of events and the relevant dates, you are off and running.
The analysis then provides a pictorial study of how fast and drastic a set of events happens (and you can compare more than one set of events). This then provides food for thought for fresh qualitative and quantitative studies.
Adding quantitative evidence to hunches
There are more complex analyses that are also possible, e.g. logistic regression, but I think you will find that the tests cited above will often be quite enough to add some quantitative evidence to hunches, and some hunches as to what to prove next.

Cole Davis is the author of SPSS Step by Step - Essentials for social and political science
ABOUT THE AUTHOR

Cole Davis
Cole Davis' previous research has included studies in education and training, health, business and community attitudes. With masters degrees in psychology and computer science, his research and writing have always encompassed an integrative approach to qualitative and quantitative work.


