


We’re excited to announce that a new version of XLSTAT is available! Thanks to our users’ suggestions, XLSTAT is constantly improving and building upon its 30 years of continuous evolution. It's clear to see why XLSTAT is the top choice for data analysis software among more than 150,000 users across 120+ countries. With XLSTAT, you can easily explore, predict, visualize, customize, and share your results without ever leaving Microsoft Excel. And now with advanced features devoted to sensory analysis, marketing, life sciences, and quality, XLSTAT ensures that you can unlock the full potential of your data from day one. With this update, you can now:
- Build optimal histograms in only three clicks.
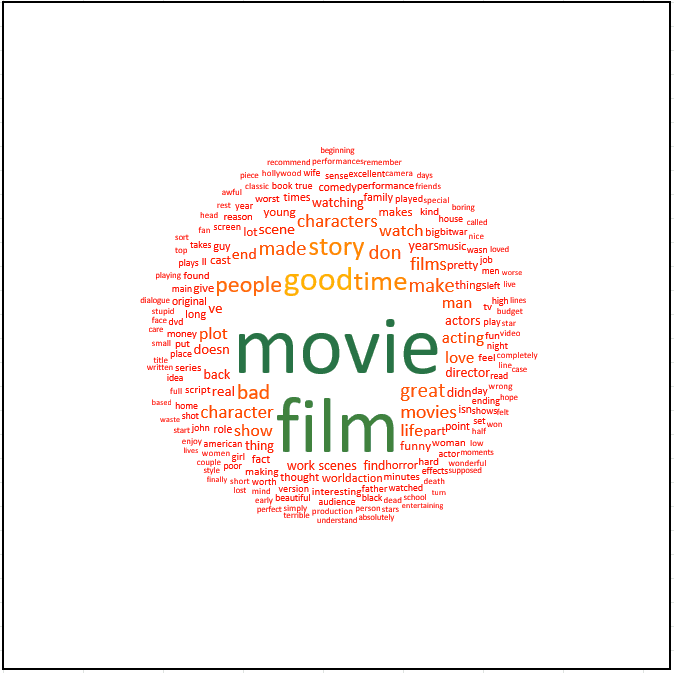
- Create a Word Cloud in a single step.
- Improve your visualizations, merge charts, and enhance your reports.
Learn more about the new release below and update your XLSTAT today to benefit from the new features.
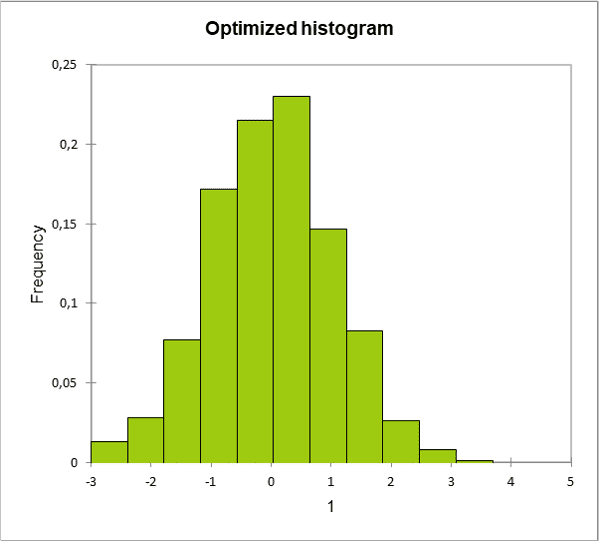
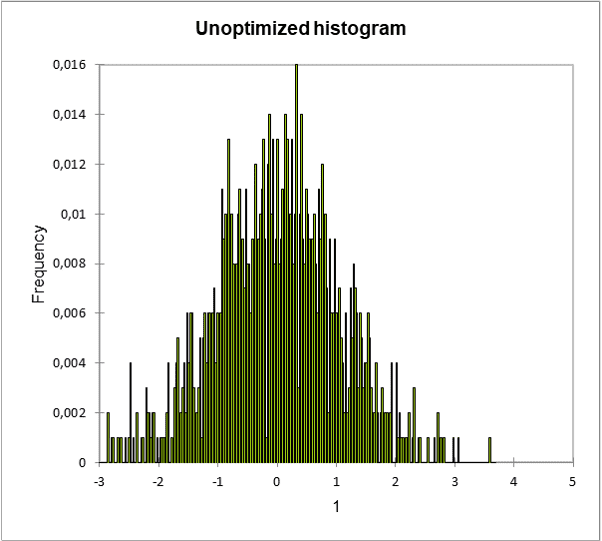
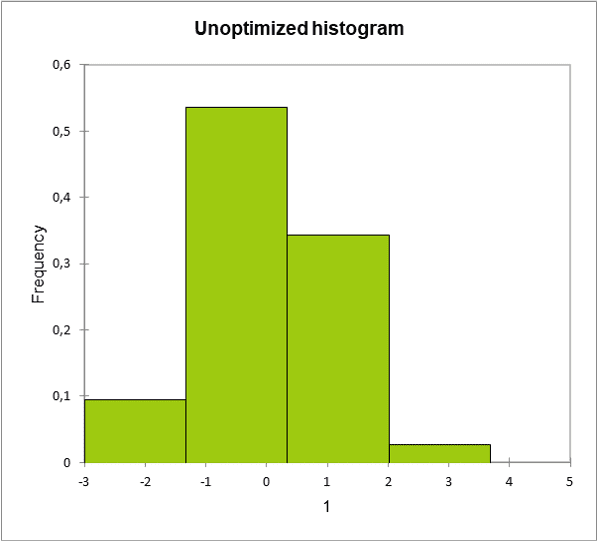
Optimal Histograms
Save time building insightful histograms as you can now automatically determine the number of bins in your histogram with our new option. An automatic option (Stuge’s rule) has been implemented to determine a relevant number of bins for histograms. With this feature, it is no longer necessary to randomly try different values.
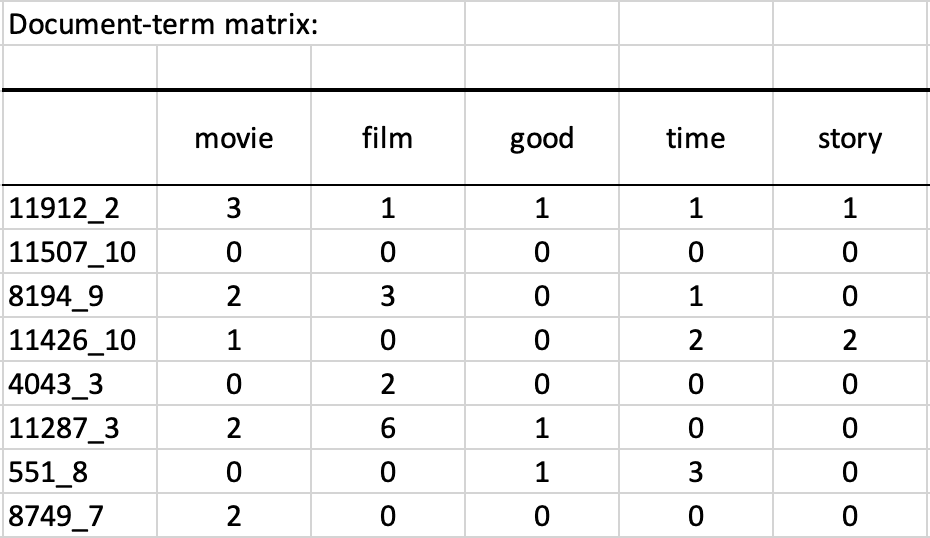
Quick Word Clouds
Efficiently build Word Clouds with a single click in the feature extraction dialog box or in the report. With this update, you can directly perform a Word Cloud in the feature extraction dialog box instead of using World Cloud feature after.
Total Unduplicated Reach and Frequency (TURF)
Save time with clear, basic results as the number of non-purchase intentions (values below a certain threshold) has been added to the report.
Interpret Power in Sensory Discrimination Tests
Power can be complicated to interpret for a non-statistician expert, so we’ve added comments to help interpret power in sensory discrimination tests. With this feature, an interpretation message is now displayed after power results.
Surface Response Analysis
Visually interpret the results of your surface response analysis as all the surface plot factors are now displayed in the charts. Plus, now more than two factors can exist in surface response.
Merge Bar Chart with Scatterplot
Build even more insightful plots as you can now merge bar chart with scatterplot in a single graph – helping you see more information at a glance. This option is available in descriptive statistics and ANOVA features.
Preference Mapping (PREFMAP)
Visualize what is more important to you by viewing the relevant aces when performing Preference Mapping. PREFMAP analyses start with a PCA that creates a collection of synthetic axes. It’s now possible to display the results for any combination of the four first axes without limiting yourself to the first factorial plan.
Understand Your Johnson Variable Transformation
Go deeper in your knowledge by understanding how your variable has been transformed. Since the formulas are displayed in the results, you can better understand how your variable has been transformed.
How to Install the Update?
This new version will give you access to all the new features mentioned above. The installation of our new version is recommended for all users.
If you have a valid XLSTAT license with access to maintenance and upgrades, you can download the new version for free. If you are currently using our trial version, you can purchase a license of XLSTAT to access these new features. Never tried XLSTAT before? Download your free trial today!

