
Sizing up Sustainability:
Dr. Sachin Kumar Mangla of the UK’s Plymouth Business School uses @RISK in his research on risk management in sustainable supply chains in India. Dr. Mangla and his colleagues examine the probable risks and consequences involved in supply chains that make an effort in reducing waste, remanufacturing, reusing, recycling etc.
Dr. Sachin Kumar Mangla, Lecturer in Knowledge Management and Business Decision Making at the Plymouth Business School, uses @RISK in his published research on risk management in sustainable supply chains in India. In this research, Mangla and his colleagues examine the probable risks and consequences involved in supply chains that make an effort in reducing waste, remanufacturing, reusing, recycling etc.
Background
“Sustainability is becoming a key word in operations and it is progressively included in the corporate strategy,” says Mangla. “Business organizations are facing increasingly pressure from different stakeholders to incorporate sustainable initiatives in the supply chains.” In order to respond to this increasing stakeholder demand on sustainability, organizations are now not only focusing on their internal processes but also on their supply chain (SC) partners to meet the demand and the term sustainable supply chain (SSC) was coined in the process.
In the published study, Mangla and his colleagues examine a well-established textile company that has been operational for ten years in India. The company managers were looking to achieve SSC and had three primary goals: first, move towards an eco-friendly system to reduce the wastage. Second, maximize economic, social, and environmental gains. Third, to effectively implement different sustainability initiatives in the business. In the meantime, the managers needed to list and manage the risks associated with SSC to improve its overall performance and achieve the three goals above.
The textile company asked Mangla and his colleagues to determine and prioritize the various risks related to SSC, and then assess the potential consequences of the identified risks in SSC.
Plymouth Business School
Using a Two-Part Process
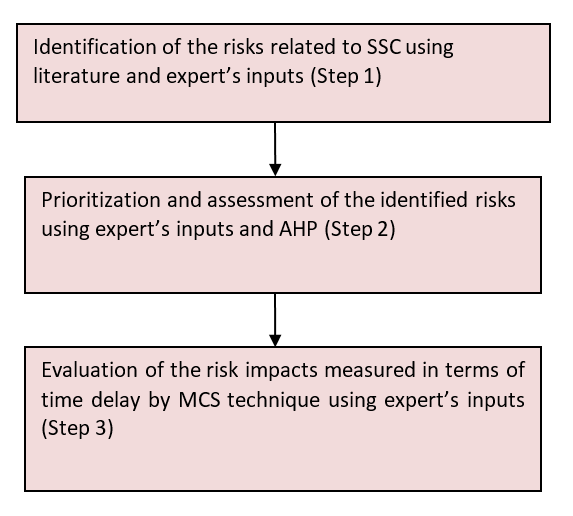
Mangla and his colleagues tackled the problem through combined Analytic Hierarchy Process (AHP) and Monte Carlo Simulation (MCS) approach. AHP helps rank and prioritize the various risks, while MSC helps explore the uncertainty around each risk and their potential impacts.
@RISK allowed Mangla to measure the uncertainties or extreme scenarios by capturing the confidence level of experts in decision-making, which otherwise remains opaque in the AHP. @RISK also helped Mangla reveal the impacts of these risks in the SSC context.
“This methodical approach (Figure 1) helps understand the probable risks and consequences to emerge in SSC,” says Mangla.
Using the AHP Method
Using the AHP method, Mangla and his colleagues first gathered knowledge and estimates from experts within the field and applied that information to a nine-point scale that analyzed the probability of occurrence of the risks and their impacts (Table 2). According to the scale 3, denotes low probability of occurrence or low impact and 9 denotes a very high probability of occurrence or high impact.
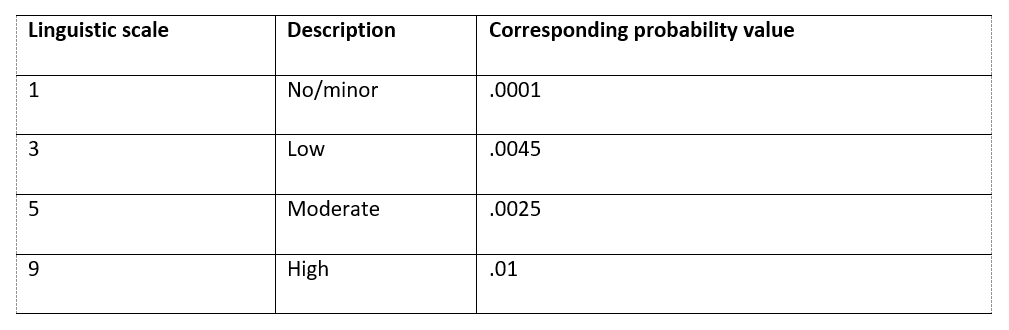
Table 2: Linguistic scale used for data collection
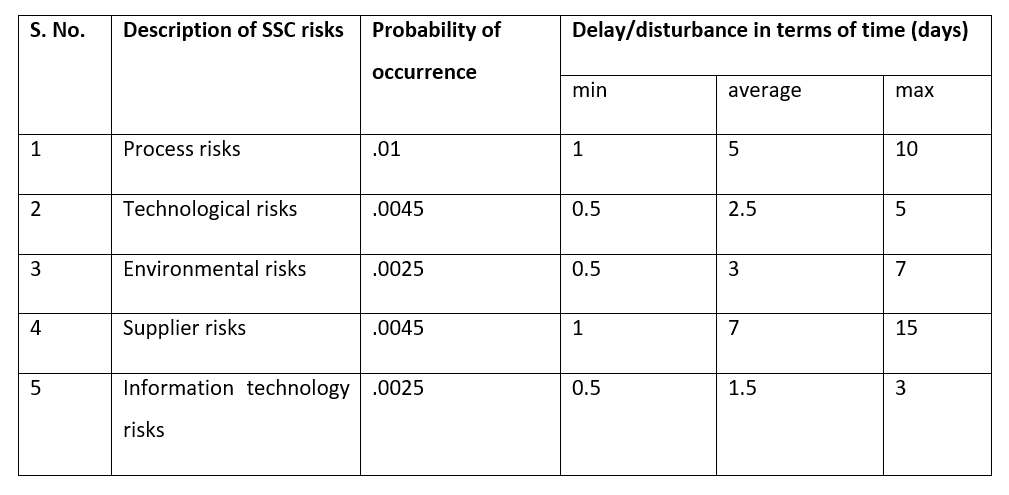
“Initially, in assessing the operational risk, we computed the probability measure for its specific risks with respect to its risk-probability measure,” says Mangla. “We then measured the delay/disturbance impacts of each operational risk on SSC performance by inputs received from the experts [as shown in Table 3.]” Based on literature support and through interviewing company experts, Mangla and his team identified five risks in SSC:
- Process Risk: the risk of loss resulting from failed intro as well as inter organizational processes
- Technological Risks: the risk of unavailable upgrades in process technologies or development of new technologies
- Environmental and Social Risks: the risk of environmental destruction and its associated harm to a corporation’s reputation, leading to decrease sales and damaged brand equity
- Supplier Risk: the risk of a suppliers failing to provide the right quantity of material on time, and providing a competitive advantage of the final goods.
- Information Technology Risks: the risk of acting on inaccurate demand information, which can lead to aggregation of inventory across the supply chain
Using @RISK
Next, Mangla and his team turned to @RISK to compute the risks and uncertainties related to possible outcomes. For example, they examined the risk of delay in the supply chain. They ran the simulation for 20,000 iterations, sampling delay impacts (inputs) and modeling them as probability distributions to analyze the occurrence of risks to SCC, and then using a triangular distribution to analyze the risks’ outcomes. They also computed the change in output mean across the range of input values of SSC risk.
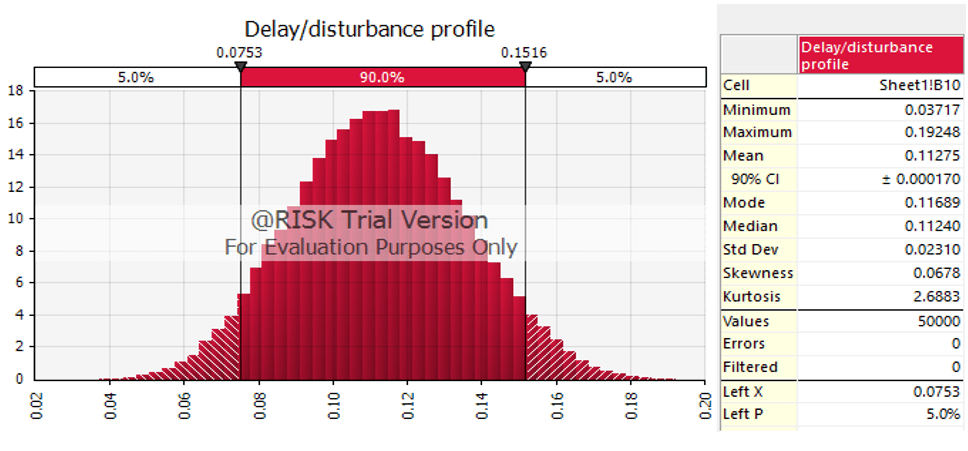
Additionally, the team estimated the risk weights by multiplying the probability measures of the risk by the delay/disturbance distributions. In Monte Carlo Simulation, the sum weight of all the risks provides the summary of the considered risk. The 90% confidence interval was considered to evaluate the delay/disturbance profile of the consequences of the risk in this work. After running the simulation, Mangla discovered these key answers:
- The mean for the outcome (profile of the SSC risk impacts) was 0.11275.
- The minimum and maximum values for the delay/disturbance profile were 0.03717 and 0.19248.
- The standard deviation was 0.02310 (shows closeness to the mean).
- The variance for the process was positive at 0.000534.
“The data taken gives an extreme scenario for assessing the SSC risk impacts measured in terms of time delay/disturbance along with the capturing of uncertainty related to that,” explains Mangla.
To better understand the potential for delay and disturbance in the scenario, Mangla also analyzed the change in output mean across the range of input values of SSC risk (Figure 3.), examining several risk factors including process, supplier, technological, environmental, and information technology risks.
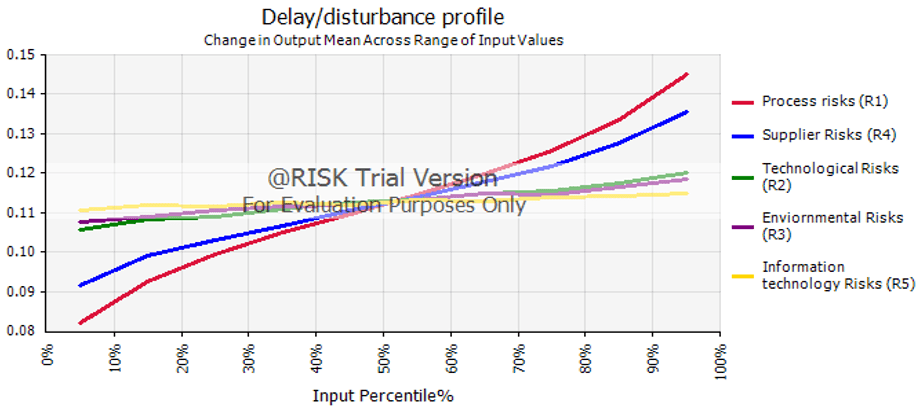
Figure 3: Change in Output Mean Across Range of Input Values of SSC Risks
Results: Ranking the Risks
After running this analysis, Mangla found there was a maximum change in output mean for risk process risks, followed by supplier risks. “We found that process risk, which mainly depends upon the processes involved in the manufacturing of sustainable products, is the most important risk in implementing SSC concepts,” Mangla explains. “Environmental and social risks acquired second place. These could include release of hazardous chemicals, inhalation of toxic substances by the workforce, and status of working culture and hours, availability of freshwater and toilets, child labor, etc.”
Supplier chain risks came next. “Sustainability issues impacts the entire SC, from the raw material supplier through to the end customer,” says Mangla. “Some SC activities fall outside the boundary of the supply chain such as processing, packaging and transportation, and the ecological and social impacts of these activities also falls beyond the control of the focal organization. It becomes increasingly challenging for focal organization to monitor and measure sustainability performance of their supply chain partners.”
Technological risks acquired fourth level in the hierarchy. “There is thus still substantial work needed to improve the product and process technology to meet the demand on sustainability,” says Mangla. “The selection of right technology will help manufacturers to reduce both costs and carbon footprints towards sustainable supply chains.”
Information technology risks came last. “Information technology risks can trigger instabilities in the supply chain system,” explains Mangla. “This makes it difficult for the organizations to estimate the sustainable product demand exactly.”
Conclusion
“Using the Monte Carlo simulations in @RISK helps to address the uncertainties in the process of managing risks to SSC,” Mangla concludes. “We believe our developed SSC risk assessment framework will help case company managers in analyzing the risks to SSC more efficiently, and could be applied to a number of other related industries in emerging economies and results may be compared with related organisations in emerged economies to benchmark the overall performance.”