Many California produce farm operations use a rule-of-thumb to determine a hedge ratio for their seasonal productions. They often aim to contract 80% of their crop in advance to buyers at set prices, leaving the remaining 20% to be sold at spot prices in the open market. The rationale for this is based on many years of experience that indicates costs and a reasonable margin can be covered with 80% of production hedged by forward contracts. The hope is the remaining 20% of production will attract high prices in favorable spot markets, leading to substantial profits on sales. Of course, it is understood spot prices might not be favorable, in which case any losses could be absorbed by the forward sales.
Since the Recession of 2008, agricultural lenders and government regulators have recognized that many farm operators need to manage the risks to their margins, and free cash flows, rather than simply focusing revenue risks. A more quantitative analysis is needed to determine risks in the agricultural industry.
Agribusiness experts from Cal Poly conducted a risk management analysis using @RISK, and found the 80% hedge ratio rule-of-thumb is not as effective as assumed. Growers do not profit from spot market sales over the long run. The analysis shows growers are better off in the long-term selling as much of their product as possible using forward contracts.
Background
Agriculture in California is big business. In 2013, nearly 80,000 farms and ranches produced over 400 commodities – the most valuable being dairy, almonds, grapes, cattle, and strawberries – worth $46.4 billion. Almost half of this value came from exports. The state grows nearly half of the fruits, nuts, and vegetables consumed in the United States. Yet agriculture is traditionally one of the highest risk economic activities.
Steven Slezak, a Lecturer in the Agribusiness Department at Cal Poly, and Dr. Jay Noel, the former Agribusiness Department Chair, conducted a case study on an iceberg lettuce producer that uses the rule-of-thumb approach to manage production and financial risks. The idea was to evaluate the traditional rule-of-thumb method and compare it to a more conservative hedging strategy.
Hedging Bets on Iceberg Lettuce Sales
The grower uses what is known as a ‘hedge’ to lock in a sales price per unit for a large portion of its annual production. The hedge consists of a series of forward contracts between the grower and private buyers which set in advance a fixed price per unit. Generally, the grower tries to contract up to 80% of production each year, which stabilizes the grower’s revenue stream and covers production costs, with a small margin built in.
The remaining 20% is sold upon harvest in the ‘spot market’ – the open market where prices fluctuate every day, and iceberg lettuce can sell at any price. The grower holds some production back for spot market sales, which are seen as an opportunity to make large profits. “The thinking is, when spot market prices are high, the grower can more than make up for any losses that might occur in years when spot prices are low,” says Slezak. “We wanted to see if this is a reasonable assumption. We wanted to know if the 80% hedge actually covers costs over the long-term and if there are really profits in the spot market sales. We wanted to know if the return on the speculation was worth the risk. We found the answer is ‘No’.”
This is important because growers often rely on short-term borrowing to cover operational costs each year. If free cash flows dry up because of operational losses, growers become credit risks, some cannot service their debt, agricultural lending portfolios suffer losses, and costs rise for everybody in the industry. Is it a sound strategy to swing for the fences in the expectation of gaining profits every now and then, or is it better to give up some of the upside to stabilize profits over time and to reduce the probability of default resulting from deficient cash flows?
Combining Costs and Revenues in @RISK
Slezak and Noel turned to @RISK to determine an appropriate hedge ratio for the grower.
For inputs, they collected data on cultural and harvest costs. Cultural costs are the fixed costs “necessary to grow product on an acre of land,” such as seeds, fertilizer, herbicides, water, fuel etc., and tend to be more predictable. The researchers relied on the grower’s historical records and information from county ag commissioners for this data.
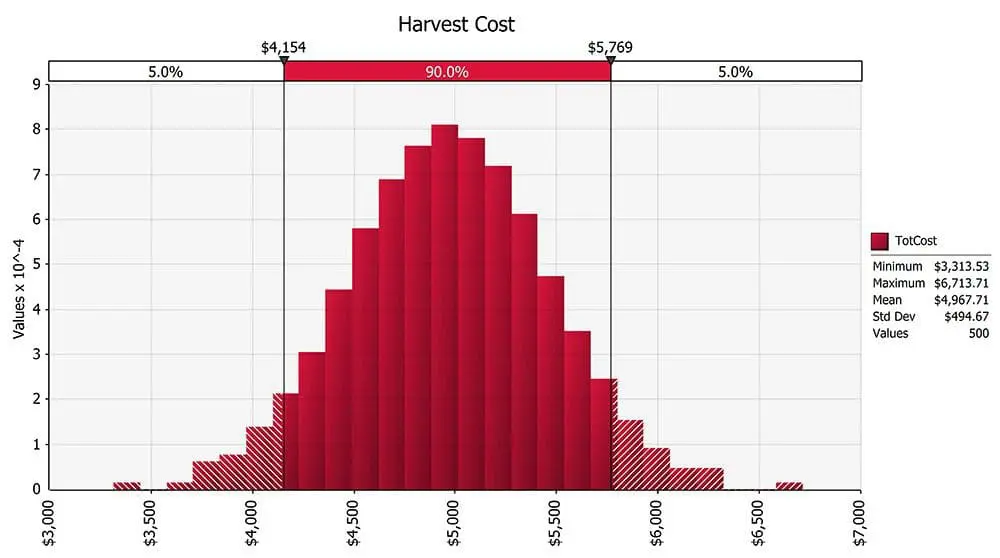
Harvest costs are much more variable, and are driven by each season’s yield. These costs include expenses for cooling, palletizing, and selling the produce. To gather data on harvest costs for the @RISK model, Slezak and Noel took the lettuce grower’s average costs over a period of years along with those of other producers in the area, and arrived at an average harvest cost per carton of iceberg lettuce. These costs were combined with overhead, rent, and interest costs to calculate the total cost per acre. Cost variability is dampened due to the fact that fixed costs are a significant proportion of total costs, on a per acre basis.

The next inputs were revenue, which are defined as yield per acre multiplied by the price of the commodity. Since cash prices vary, the grower’s maximum and minimum prices during the previous years were used to determine an average price per carton. Variance data were used to construct a distribution based on actual prices, not on a theoretical curve.
To model yield, the grower’s minimum and a maximum yields over the same period were used to determine an average. Again, variance data were used to construct a distribution based on actual yields.
StatTools, included in DecisionTools Suite, was used to create these distribution parameters. @RISK was used to create a revenue distribution and inputs for the model. With cost and revenue simulation completed, the study could turn next to the hedge analysis.

Steven Slezak
Agribusiness Department, Cal Poly University
To Hedge, or Not to Hedge?
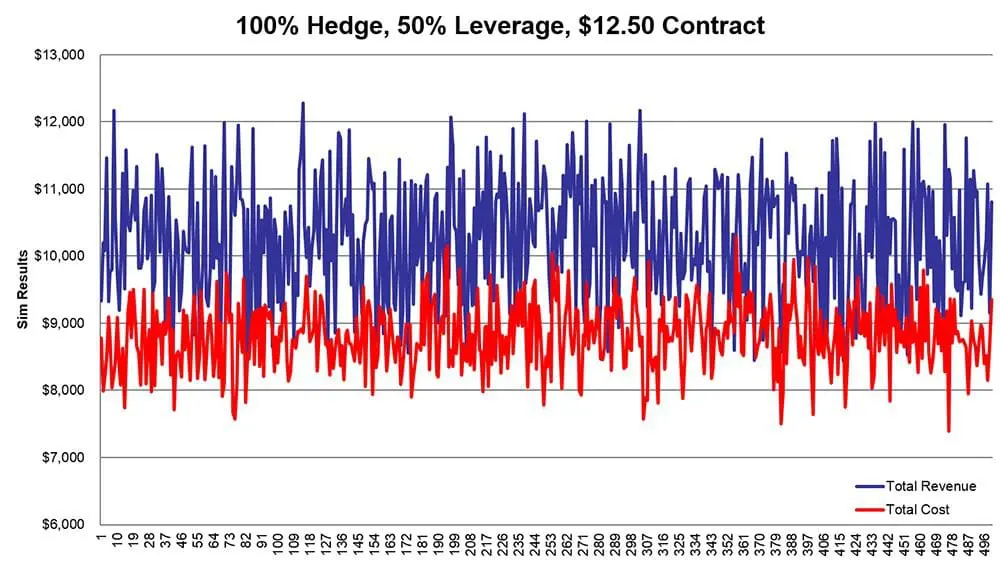
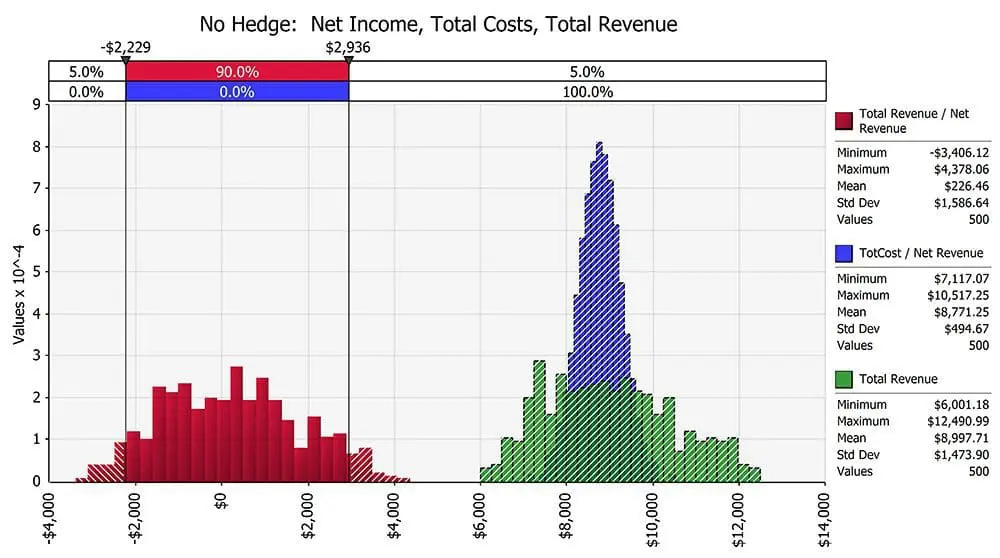
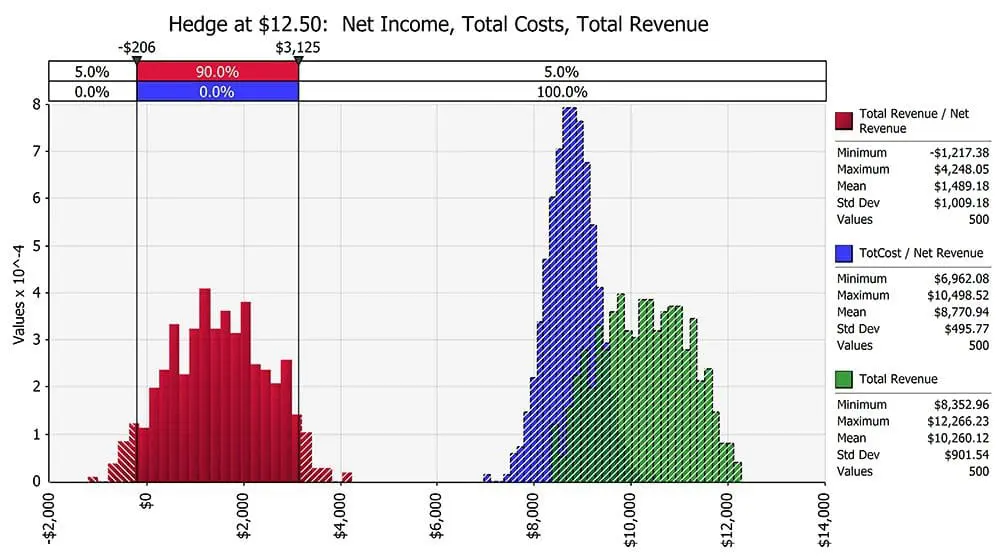
Since the question in the study is about how best to manage margin risk – the probability that costs will exceed revenues – to the point where cash flows would be insufficient to service debt, it was necessary to compare various hedge ratios at different levels of debt to determine their long-term impact on margins. @RISK was used to simulate combinations of all costs and revenue inputs using different hedge ratios between 100% hedging and zero hedging. By comparing the results of these simulation in terms of their effect on margins, it was possible to determine the effectiveness of the 80% hedging rule of thumb and the value added by holding back 20% of production for spot market sales.

Unsurprisingly, with no hedge involved, and all iceberg lettuce being sold on the sport market, the simulation showed that costs often exceeded revenues. When the simulation hedged all production, avoiding spots sales completely, the costs rarely exceeded revenues. Under the 80% hedge scenario, revenues exceeded costs in most instances, but the probability of losses significant enough to result in cash flows insufficient to service debt was uncomfortably high.

It was also discovered that the 20% of production held back for the purpose of capturing high profits in strong markets generally resulted in reduced margins. Only in about 1% of the simulations did the spot sales cover costs, and even then the resulting profits were less than $50 per acre. Losses due to this speculation could be as large as $850 per acre. A hedging strategy designed to yield home runs instead resulted in a loss-to-gain ratio of 17:1 on the unhedged portion of production.
Slezak and his colleagues reach out to the agribusiness industry in California and throughout the Pacific Northwest to educate them on the importance of margin management in an increasingly volatile agricultural environment. “We’re trying to show the industry it’s better to manage both revenues and costs, rather than emphasizing maximizing revenue,” he says. “While growers have to give up some of the upside, it turns out the downside is much larger, and there is much more of a chance they’ll be able to stay in business.”
In other words, the cost-benefit analysis does not support the use of the 80% hedged rule-of-thumb. It’s not a bad rule, but it’s not an optimal hedge ratio.
Early @RISK Adopter
Professor Slezak is a long-time user of @RISK products, having discovered them in graduate school. In 1996, “a finance professor brought the software in one day and said, ‘if you learn this stuff you’re going to make a lot of money,’ so I tried it out and found it to be a very useful tool,” he says. Professor Slezak has used @RISK to perform economic and financial analysis on a wide range of problems in industries as diverse as agribusiness, energy, investment management, banking, interest rate forecasting, education, and in health care.
Originally published: Oct. 13, 2022
Updated: June 7, 2024
