


Update Your XLSTAT Version to Unlock Smarter, Better, and Faster Insights
Make more informed product decisions and improve your overall market research experience with the latest version of XLSTAT.
XLSTAT’s new release lets you dig deeper into your market research, obtain insights faster, and present powerful visualizations – improving the entire market research process. Check out the improved features in XLSTAT that let you quickly determine the quality of your models, compare consumer segments, and prepare insightful graphics for key stakeholders.
Conjoint Analysis: Consumer Segments
Improved Feature Included in Marketing and Premium
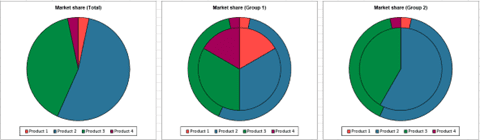
Quickly compare your consumer segments with the improved consumer segments function in the conjoint analysis simulation tool. Save time by gaining insights from your segments separately in a single analysis by using the option group variable to perform an analysis by segmenting and comparing them.
Conjoint Analysis: Model Validation
Improved Feature Included in Marketing and Premium
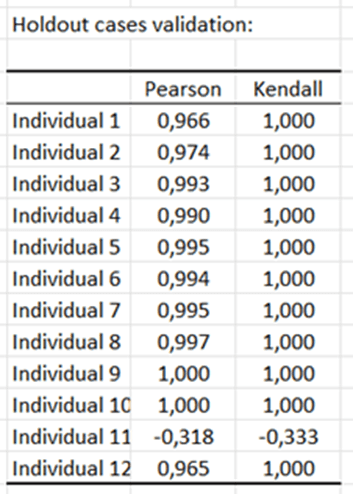
Determine if you can make strong conclusions with your model with the conjoint analysis model validation function. Inside the design for conjoint analysis and in the Choice-based Conjoint analysis features, you can add holdout cases options to validate a conjoint model with Pearson, Kendall, or RLH index.
Conjoint Analysis: Visualization
Improved Feature Included in Marketing and Premium
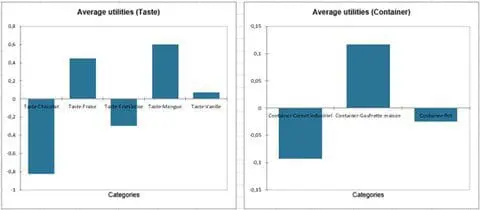
Easily visualize insights with advanced filtering by displaying the utility diagrams per factor with the new visualization function. Inside the conjoint analysis dialog box’s inside charts tab, you can choose to display the utility diagrams per factor – giving you a better visualization of the utilities!
Conjoint Analysis: No Choice Option
Improved Feature Included in Marketing and Premium
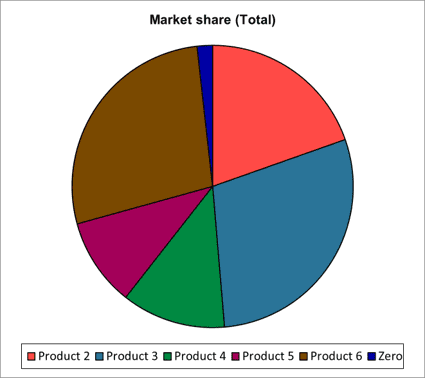
Give your respondents the opportunity of not choosing! With the new no choice option, you can analyze your data with “non-choices” from certain respondents. Within the Choice-based Conjoint analysis function, if a respondent did not wish to make a choice, you can indicate this with a zero. This will mean that they had no preference between the different samples and were not able to make a choice. This option is now considered in the analysis.
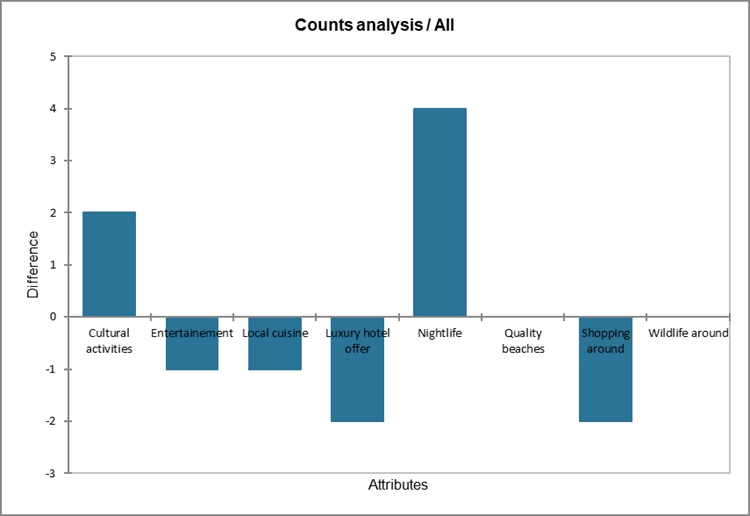
New MaxDiff Visualization
Improved Feature Included in Marketing and Premium
Quickly see MaxDiff results without searching to easily determine the best choice impact items for your marketing or product strategy. The bar charts of difference scores and MaxDiff scores have been added to the MaxDiff feature results for faster and better visualization of the main insights.
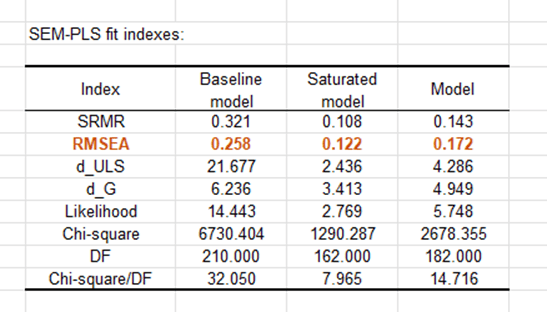
PLSPM Model Evaluation
Improved Feature Included in Marketing, Sensory, and Premium
Go deeper in your PLSPM data analysis and improve the quality evaluation of your PLSPM models with the new RMSEA index. The computation of the RMSEA index is now performed and displayed in the SEM-PLS fit indexes table.
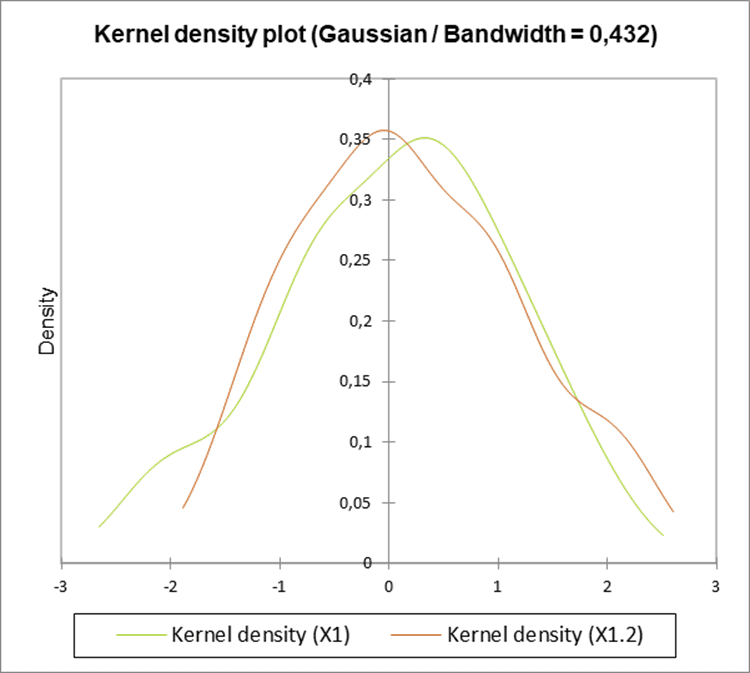
Kernel Density Estimation
Improved Feature Included in All Solutions
Easily visualize and compare your distributions with subsample density estimation with the Kernel density estimation feature. If you want to display all the samples in the same chart, simply check the box “All series on one chart”. Thanks to this new function, you can for instance quickly see the differences between different regions.
How to Install the Update?
This new version will give you access to all the new features mentioned above. The installation of our new version is recommended for all users.
If you have a valid XLSTAT license with access to maintenance and upgrades, you can download the new version for free.
If you are currently using our trail version, you can purchase a license of XLSTAT to access these new features.
Never tried XLSTAT before? Download your free trial today!


