
This post started life on the NSMNSS blog—a great initiative (run jointly by NatCen Social Research and SAGE) that fosters lively discussion about the challenges of working with social media data.
Imagine you’re sitting on a qualitative goldmine—in-depth interviews, focus groups, intriguing survey results, nuanced observations and a comprehensive lit review.

All the traditional boxes are checked and yet there’s the nagging feeling that something is missing.
Chances are, it’s social media—and that’s probably why you’re here.
The Challenges
There are so many impassioned and revealing conversations taking place online that it’s becoming harder (and more dangerous) to ignore them.
But embracing social media is not straightforward and you may be grappling with questions such as:
- How do I build social media into my research design?
- What platforms are worth concentrating on?
- How should I collect the data?
- What tools and methods should I use to analyse it?
NVivo gives you a practical way to face these challenges.
NCapture the web
If you already work with NVivo, you’ll know that it’s a tool for organizing and analyzing qualitative data—but you may not realise that NVivo 10 for Windows comes with a raft of features to support your foray into the brave new world of social media.
It all starts with NCapture.
This small but powerful plugin sits quietly at the top of your browser (Internet Explorer or Chrome) and lets you capture web pages and social media—and then bring them into NVivo for analysis. It’s a bit like that helpful elephant from Evernote.
You can also capture YouTube videos and conversations from Facebook, Twitter or LinkedIn*. This is a boon for researchers who want to facilitate ‘online focus groups’ using these social media platforms—as well as for those who want to get a well-rounded view of their topic by following the latest conversations.
This brief video (with lovely music) shows you how to gather Twitter data using NCapture:
If you use NVivo 10 for Mac — you can use NCapture to clip web pages (and other social media features are coming soon).
Now, let’s focus on 7 ways NVivo helps you to make sense of your social media data.
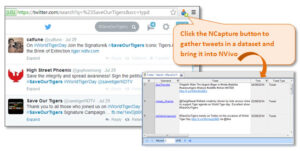
#1: Gather tweets or posts in a dataset
You can search for tweets in your browser and then use NCapture to pull them into a PDF or dataset. The dataset is especially handy because you can filter or sort the content—and use tools to slice and dice the data in different ways.
You can do the same for discussions and posts from Facebook or LinkedIn—on these platforms, you can also use the biographical data from user profiles to compare attitudes (men vs women, young vs old—that kind of thing).
Sometimes you have to work around the limitations of a particular platform. For example, the number of tweets you can capture is determined by Twitter and can vary depending on the vagaries of Twitter traffic. To follow a particular topic over time, the best approach is to take captures at periodic intervals.
If you want to know more about the inner workings of Twitter—there is a fantastic post right here on NSMNSS blog.
#2: Visualize the most frequently used words
You can run a Word Frequency query to see which words contributors are using most often—this can help you get a handle on the themes in your social media data.
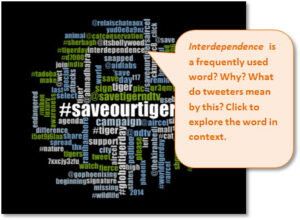
Visualizing the results in a word cloud may spark insights and reveal connections—they can also liven up a presentation, final paper or blog post.
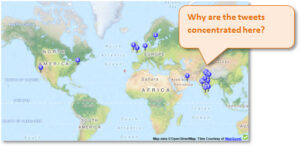
#3: Map the location of tweets or posts
You can open a map to see where the action is—and then use this as a launching point for further investigation. For example, you could click on a pin to see the tweets or posts from a particular location.
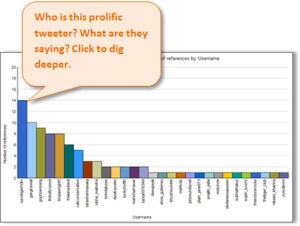
#4: Chart users by the number of followers
Shares, likes and follows are the new social currency and they can help to inform your research. If you’re exploring Twitter users - you can create a chart to compare the numbers:
#5: Organize the content into themes
You know that qualitative goldmine I mentioned earlier? Well, you can bring the whole thing into NVivo 10 for Windows (including your newly NCaptured social media data) and use ‘coding’ to organize it into themes.
For example, whenever you see a reference to ‘education’—whether it be in an interview, article or social media conversation—you can select the content and code it at a ‘node’. Then you can open the node (which is a fancy word for container) and explore all the references to ‘education’ in one place.
Coding is a great way to wrangle the chaos of qualitative data—and it’s slightly addictive.
#6: Explore by username or hashtag
Do you want to gather tweets from a particular user or hashtag? If your tweets are in a dataset, then ‘auto coding’ is your answer. You can easily roll up the tweets to coding collections by username, by hashtag (what did everyone say about #NSMNSS?), or even by location.
Speaking of hashtags - why not start your own Twitter chat to gather feedback about an issue or idea?
#7: Press the ‘Analyze This’ button
Can’t find it?
That’s because, as awesome as NVivo is, it won’t do the analysis for you.
Don’t fret because you’ll find plenty of tools for querying the data as well as ways of organizing your own analytical insights (including memos, annotations, models and framework matrices).
Explore the possibilities
Social media has opened a Pandora’s box of opportunities for qualitative research—but you needn’t be overwhelmed because NVivo provides a safe to place to put the box while you explore its contents.
Maybe you’re already using NVivo to analyze your social media data?
Love to hear how it’s going.
* (update 22/06/15) LinkedIn recently limited access to their web service (API), restricting the information available to apps like NCapture. As a result, you can no longer capture a LinkedIn group discussion as a dataset using NCapture. You can still capture a group discussion, and any other page in LinkedIn, as a PDF.