Pitting and corrosion of metals at sea is a major problem, especially with off-shore equipment that is required to process oil and gas 24 hours a day. Indeed, metal degradation costs are estimated around $1.372 billion. Dr. Kenneth of the University of Adelaide applied @RISK to create a predictive map of the likelihood of naturally-caused corrosion of metal structures in a saliferous environment. To do this, he and his colleagues invented "isorisques" - contours of equal probability of risk of metal corrosion, or "pitting," drawn on a map. This unique form of analysis could establish a new, manifold atlas of world pitting risk. The work was shortlisted for the IChemE Global Awards (Most Innovative Product) 2016.
Dr. Kenneth Davey, FIChemE, FAIFST, CEng, CSci, a Senior Lecturer in the School of Chemical Engineering at The University of Adelaide, applied @RISK to create a predictive map of the likelihood of naturally-caused corrosion of metal structures in the saliferous environment of Bass Strait. Pitting and corrosion of metals at sea is a major problem, especially with off-shore equipment that is required to process oil and gas 24 hours a day. Indeed, metal degradation costs are estimated around $1.372 billion. Although pitting is reasonably well understood, initiation due to naturally occurring random, fluctuations in sea temperature and salinity has not been reported, and the impact of these variables has traditionally been overlooked. This represents a potential risk. A quantitative understanding of the risk of potential metals failure as pitting initiation is therefore important, especially with large offshore equipment that is needed for non-stop oil and gas processing.
Approach
To analyze risk and quantify natural fluctuations, Dr. Davey and colleagues Dr. Olivier Lavigne, Research Fellow School of Mechanical Engineering, and senior-undergraduate Mr. Parth Shah of The University of Adelaide, used @RISK to establish a probabilistic and quantitative framework that is predicated on established underlying unit-operations. “Our view contrasts with traditional deterministic alternatives in chemical engineering in which random fluctuations are omitted, or more strictly, ‘hidden,’” says Davey.
First they applied the probabilistic method Davey and his co-workers had developed with previous research efforts to quantitatively predict risk, and used it to create a new map for metals pitting at sea. “To demonstrate our method, we chose the Bass Strait because this has some 23 offshore oil and gas platforms,” says Davey. “It was sufficiently large enough for our purpose, and we were able to get sea temperature and chloride data for this region from the National Oceanographic Data Center.”
Using a newly synthesized equation, the researchers determined stainless steel alloy AISI 316L’s ‘pitting potential,’ EPIT. They determined that for pitting to initiate, EPIT must be ≤ EOCP, the open-circuit potential of the steel.
Inputs for the Monte Carlo (Latin Hypercube) simulations were sea temperature and salt concentration. To mimic naturally occurring fluctuations about the mean value of sea temperature and chloride concentration, Davey and team used distributions centered on the means; these were normal and truncated. “This was done to limit sea temperature and chloride concentration to those values that could practically occur,” Davey explains. For the purposes of the simulation, they set a metal’s tolerance (safety margin) at 3%.
Dr. Kenneth Davey
School of Chemical Engineering, The University of Adelaide
Results
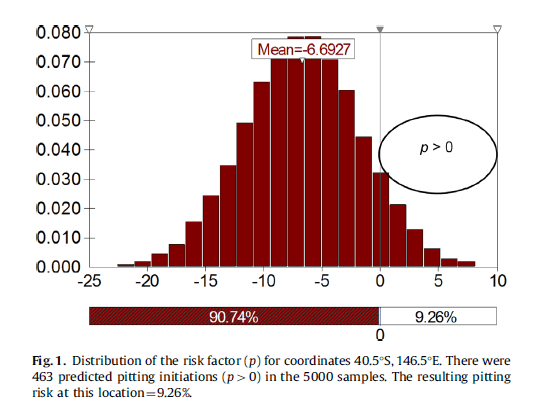
Davey and colleagues ran 5,000 iterations of Monte Carlo simulations. The distribution for sea temperature was found to be defined by RiskNormal (14.18, 2.84, RiskTruncate (5.672, 22.68))—a normal distribution with a mean of 14.18 and a standard deviation of 2.84, but truncated to a minimum 5.672 and a maximum 22.68 ◦C i.e. ± 3stdev (meaning 99.7% of all random samples will fall in this interval). Similarly, the distribution used for chloride concentration is normal with a mean 19,624, stdev 981.2 and truncated to a minimum and maximum, respectively, 16680.4 and 22567.6 ppm.
There were 463 predicted failures as pitting initiation in the 5000 samples, i.e. 463 samples with a pitting potential below the open circuit potential plus the tolerance, all identified by p > 0. The resulting pitting risk at these coordinates is (=463 / 5000 x 100) 9.26 % as highlighted to the right of Fig. 1.

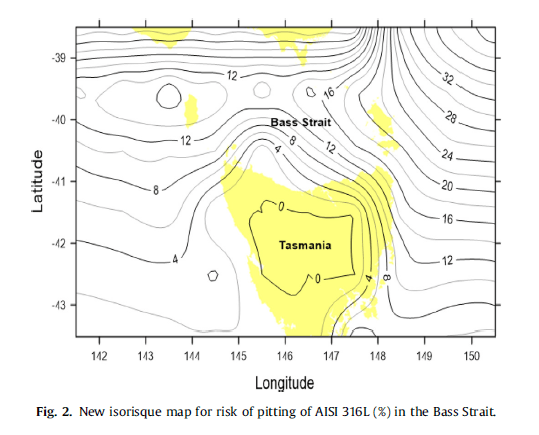
Davey and colleagues continued to run similar simulations for pitting risk at different latitude and longitudes within the Bass Strait.
After doing so, they devised ‘isorisques,’ which they propose as contours of equal probability of risk pitting, drawn on a map - similar to a topographical map. Figure 2 below shows the isorisque map of the pitting risk of AISI 316L in Bass Strait.

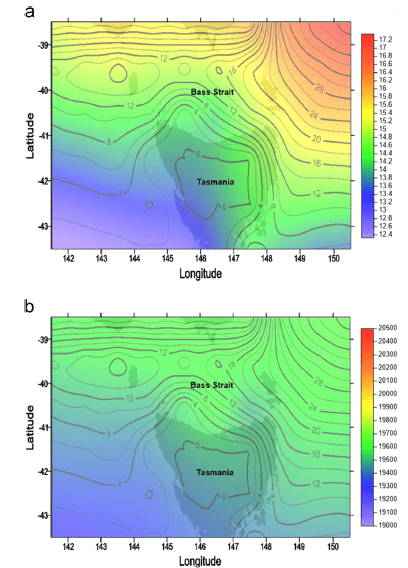
For even greater context, Davey and Lavigne overlaid this data with temperature profiles and chloride concentration profiles in the Bass Strait (Figure 3, below).

According to Davey, a more refined version of this atlas could be a predictive guide to improve metals selection and corrosion mitigation, and to compute pitting risks with changes in sea surface temperature and salinity. The atlas in digital form could be updated in real time to reflect significant climatic events.
Davey and colleagues used @RISK to create these novel maps for several reasons. “We use @RISK because we found it to be user-friendly and reliable, together with reasonable graphics,” says Davey. “In particular, we like that it is imbedded in widely understood spread sheeting.” Additionally, @RISK “solves the problem of large data generation by providing a stable, refined (Latin Hypercube) Monte Carlo sampling and simulation of the underlying mathematics of pitting and generation of the new isorisques.” In time, @RISK will help create a novel world atlas of risk of pitting at sea.
