
Aerospace and defense programs operate on decade-long timelines where risks evolve alongside technologies, threats, and regulatory requirements. To keep capabilities aligned with strategic objectives, organizations must move beyond static risk registers toward a more connected approach that quantifies uncertainty, establishes clear governance, and links risk insights directly to decision-making. By maintaining visibility across the program lifecycle and understanding how risks, probabilities, and trade-offs interact, leaders can make more informed decisions that support operational effectiveness.
Aerospace and defense programs operate in demanding environments where operational risks compound. Long lifecycles, evolving regulatory requirements, and complex coordination across engineering teams, suppliers, and government stakeholders mean programs must stay aligned with strategic objectives over many years. When risk is framed too narrowly or managed as a static checklist, even technically successful projects can drift away from their original purpose—ultimately undermining mission effectiveness.
Program lifecycles often span 10–20 years from concept to operational deployment. Over that time, threats evolve, technologies advance, and regulatory expectations shift.
Organizations supporting defense programs often treat delivery as the finish line—but operational relevance begins long before a capability arrives on-site. When risk is framed poorly, even technically sound solutions can become misaligned with strategic intent. A program may meet engineering milestones and budget targets, yet still fall short if the delivered capability no longer addresses the operational environment it was designed for.
Senior management and the board need visibility into how these risks connect. In aerospace and defense, risk impacts safety, mission readiness, and regulatory compliance. Internal audit teams and oversight bodies also require defensible evidence that risks are being systematically identified, quantified, and managed across the program lifecycle.
The question isn’t whether risks will appear—it’s whether your team can see how risks connect, understand the probabilities and trade-offs involved, and make decisions with the full context needed to support mission success.
Explore defense risk management insights from Andrew Lawson, Lumivero’s Lead Expert for Defense and National Security in, “5 lessons learned in defense risk management.”—Read now.
Long timelines and complex engineering dependencies mean aerospace programs operate under significant uncertainty. Traditional project planning methods often rely on single-point estimates for cost and schedule, which rarely reflect the true variability in large defense programs.
Quantitative risk analysis helps organizations understand that uncertainty before major commitments are made.
Monte Carlo simulation allows teams to model thousands of potential outcomes based on uncertainties across engineering timelines, supplier performance, testing milestones, and regulatory approvals. Instead of relying on one forecast, leadership can see the probability distribution of possible outcomes.
Simulation helps answer questions such as:
By quantifying uncertainty early, organizations can move beyond optimistic assumptions and gain a clearer understanding of true program risk exposure.
See how multinational defense contractor, QinetiQ, used probabilistic modeling to evaluate the risks of introducing new technology in this case study—read now.
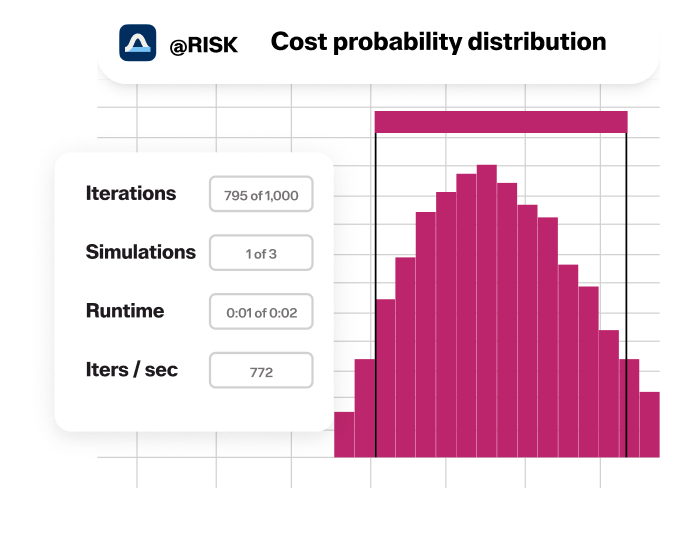
Cost probability distribution example in @RISK.
Once uncertainty is understood, the next step is governance.
In many aerospace organizations, defense risk management begins with project-level risk logs maintained by engineering teams or individual program offices. While these logs capture known issues, they often remain disconnected from program leadership and strategic decision-making.
Effective risk management requires a structured framework with clear ownership and shared visibility.
This typically includes:
When quantitative modeling is incorporated into this process, traditional risk registers evolve into probabilistic risk registers.
Instead of tracking risks only as qualitative ratings like “high” or “medium,” probabilistic registers incorporate forecast outputs such as confidence ranges and likelihood distributions. This provides leadership with a more accurate picture of potential program outcomes.
See how Babcock implemented structured risk governance across complex defense programs in this case study—read now.
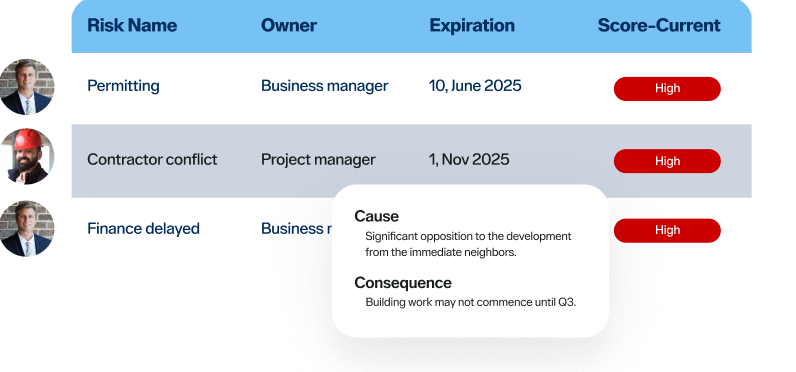
View of risk ownership and scores in Predict!
Risk registers document what's known. Decision-ready risk data shows leaders what to do about it.
In aerospace programs, mitigation strategies almost always involve trade-offs between cost, schedule, performance, and mission readiness. Leaders need to see those trade-offs before they commit.
For example, accelerating testing to meet regulatory requirements might relieve compliance risk but strain engineering resources. Without visibility into that tension, teams optimize locally while programs underperform.
This is where structured risk evaluation becomes essential. By assessing each risk based on severity, likelihood, and confidence, teams can determine the most appropriate response. High-severity risks with strong evidence demand immediate mitigation. Uncertain but potentially catastrophic risks require contingency planning. Lower-impact risks may be monitored or accepted.
This structured approach helps teams prioritize mitigation efforts and ensures that responses are proportional to the potential impact. It also creates a clear pathway from analysis to action. In many aerospace programs, mitigation investments can have effects beyond a single risk or project—one action may reduce exposure across multiple programs or subsystems. Understanding those connections helps organizations identify mitigation strategies that deliver broader impact and stronger return on investment.
When risk insights are directly connected to decision-making, risk management becomes a strategic planning tool rather than a reporting exercise.
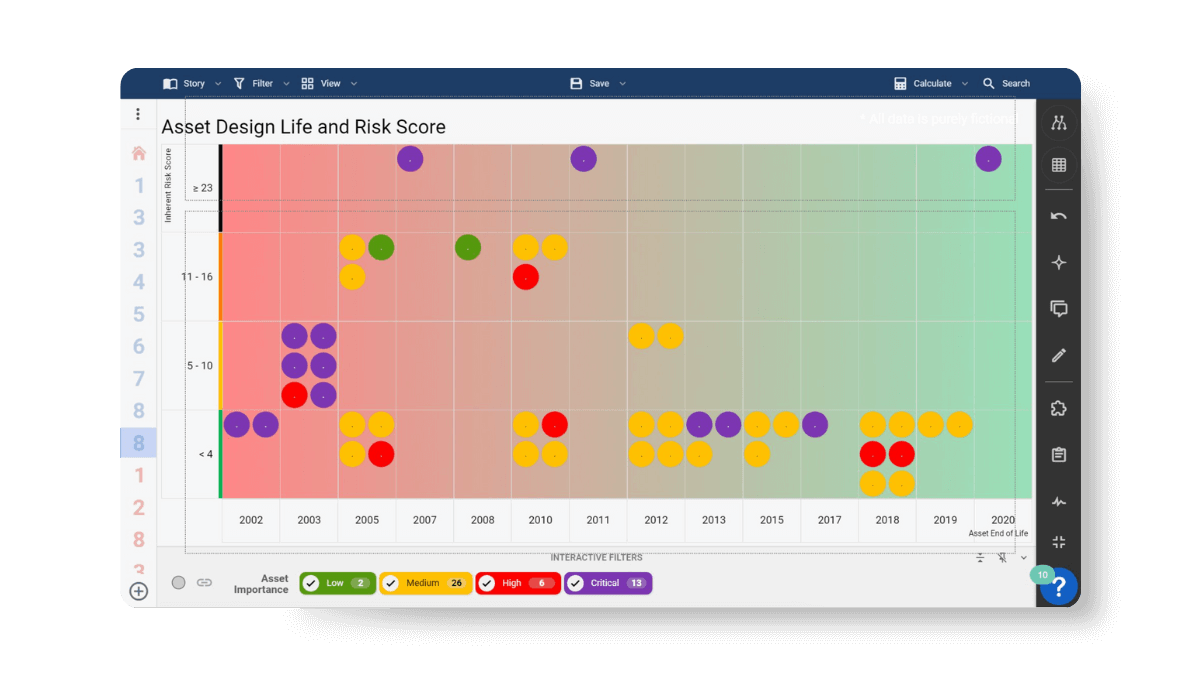
Asset design life and risk score in SharpCloud.
Aerospace programs evolve over years or decades, and risks change as programs move from concept design to manufacturing, integration, and operational deployment.
One of the most common lessons from defense programs is that risk visibility often becomes fragmented as programs progress.
Engineering teams track technical risks. Procurement monitors supplier risks. Program leadership reviews high-level reports. But these perspectives are rarely connected.
Without connected visibility, risks that appear manageable within a subsystem can escalate quickly when dependencies across teams, suppliers, and systems are not visible.
Maintaining connected risk visibility helps organizations:
This visibility becomes critical when leaders must make high-impact program decisions, such as:
These decisions rarely involve a single risk. They require understanding how technical, operational, and program-level risks interact across the broader system.
See how Team Defence Information used SharpCloud to connect complex risk and program data, giving defense leaders the shared visibility needed to support better decisions across major programs—read now.
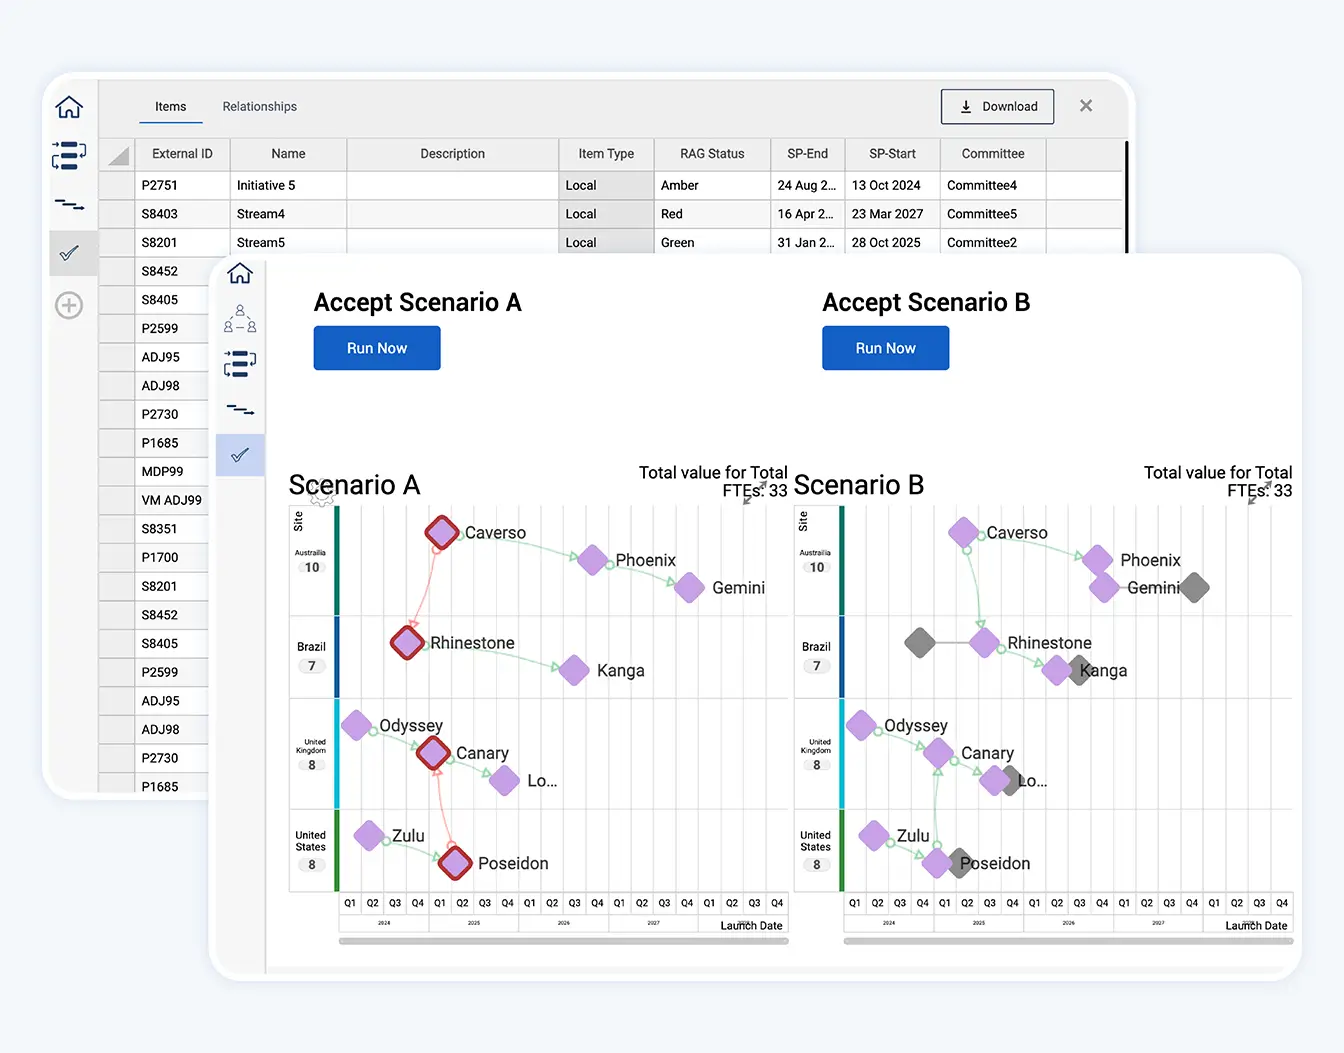
Scenario comparison in SharpCloud, showing connected decisions.
In high-performing aerospace and defense programs, risk isn't managed around—it's managed through. Risks are visible, trade-offs are clear, and decisions are defensible. When conditions change, programs adapt with confidence.
That happens when teams move from static risk registers to connected risk visibility—when operational risks, regulatory requirements, and strategic priorities are visible in one place, and when people can act before exposure becomes a crisis.
See how Lumivero’s risk and decision software helps aerospace and defense programs maintain connected risk visibility—request a demo today.
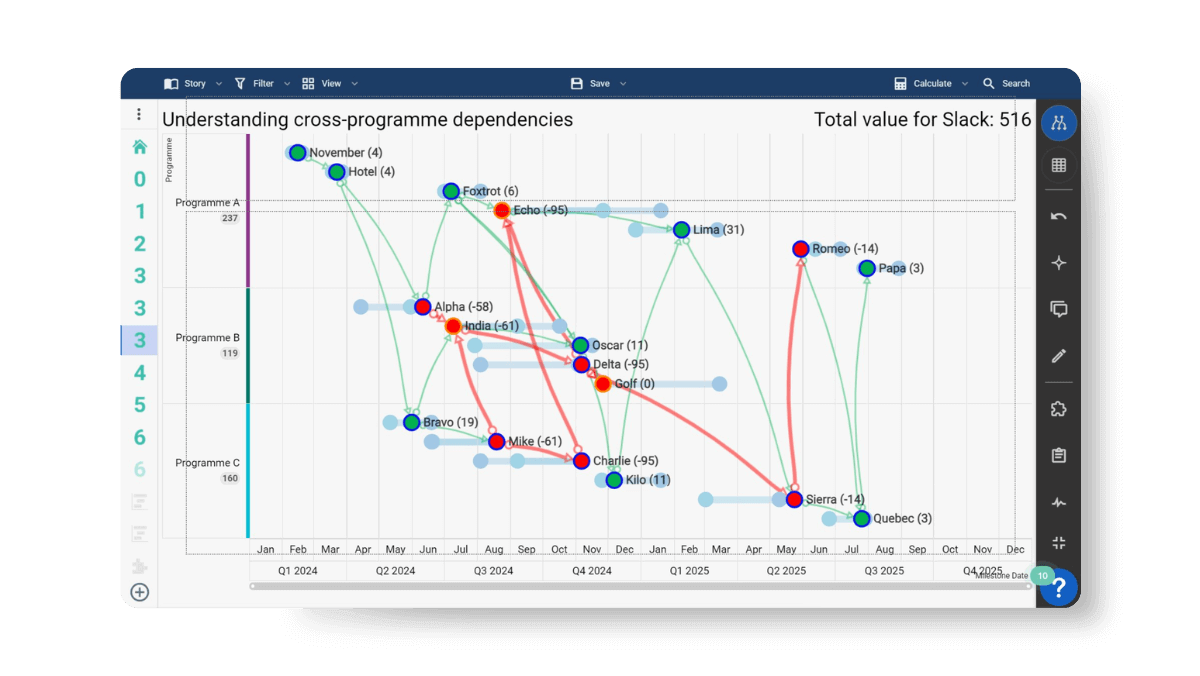
Understanding cross-program dependencies in SharpCloud.
Managing risk across complex aerospace programs requires more than spreadsheets and static reporting.
Operational risk management software should connect risk, controls, resources, and outcomes. While isolated tools create data silos, integrated platforms show how control failures affect resources, how constraints affect dependencies, and how dependencies ultimately affect delivery. That connected view turns risk data into decision support.
Technology also enables scenario planning, allowing teams to test potential disruptions before they occur. What happens if a supplier fails? What if regulatory approval is delayed by six months? What if integration testing uncovers a critical subsystem issue?
Exploring these scenarios in advance allows teams to understand potential impacts and prioritize mitigation strategies before risks escalate.
Lumivero's risk and decision software makes this possible by combining simulation, structured risk governance, and connected program visibility.
For example:
With these capabilities, organizations can evaluate critical program decisions with full context, including:
Instead of relying on fragmented reports, leadership teams gain a connected view of risk across the entire program landscape.
Together, these tools transform risk management from static reporting into a living decision-support framework. Instead of waiting for periodic reviews, organizations can continuously evaluate scenarios, update risk forecasts, and adjust mitigation strategies as programs evolve.
The goal is not to eliminate uncertainty—but to give organizations the visibility needed to navigate it with confidence.