


PragmaRisk is a risk management consultancy based in northern France, that provides services and support covering enterprise risk management, project risk management and quantitative risk assessment (QRA).
The company’s key focus is the engineering and construction sector, with clients including Technip, Alstom, Air Liquide, SBM, CB&I, Heurtey Petrochem and Prosernat, and it has delivered risk analysis, QRA and training projects across Europe, North America, the Middle-East and Asia.
PragmaRisk helps its clients to develop risk management best practices. This includes using Monte Carlo simulation to quantify the risks and uncertainties inherent in the execution of a project, and advising on contingency funding and budgets. It also carries out enterprise risk management (ERM) in the form of risk profiling, portfolio analysis and risk datamining (which helps organisations collect and structure data so that it benefits their ERM programme).
Using @RISK for contingency planning
The objective of contingency recommendation and monitoring is to account for the many uncertainties when planning budgets in order to determine the amount of contingency fund that should be added to the original budget, or to check whether what has been allowed to date is enough. PragmaRisk performs integrated cost and schedule QRA using @RISK (part of Palisade’s DecisionTools Suite) throughout the life of a project, which can run over several years.
Common and seemingly simple occurrences can have detrimental effects on the budget. For example, a construction project over-running means that equipment and manpower must be hired for longer, while costly schedule recovery plans (such as working at night) may be required and contractual damages for delay applied.
PragmaRisk’s models are able to bring together cost and schedule modelling in one environment, because @RISK bridges Microsoft Excel and Microsoft Project. It can also exploit ‘data exports’ from other project scheduling software.
Bruno Berroyer, the founder of PragmaRisk, is an experienced risk manager. He has used other Monte Carlo software, but prefers @RISK. He explains: “@RISK integrates really well with Microsoft Excel, which is a big advantage in terms of productivity when we are developing risk models. In addition, the software is integrated with the popular MS Project, which makes the modelling process quicker and smoother. Overall, Palisade’s DecisionTools is exactly that – a ‘toolbox’ that enables advanced risk analysis.”
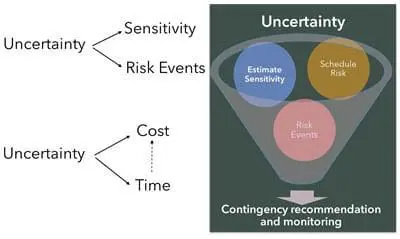
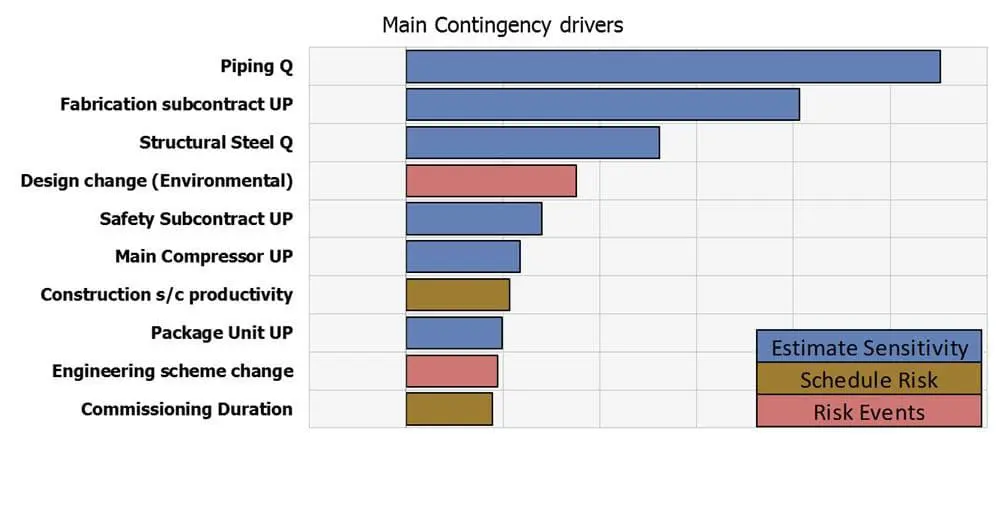
Models account for the cost estimate / budget sensitivity aspects, but also the risk / opportunity events (contractual, sourcing, technical, etc) that can affect the execution plan of the project.
In line with guidelines from the Engineering and Construction Risk Institute, this approach can be illustrated as follows:
Data plays a key role in cost engineering and risk management
Safety and Environmental QRAs use publically available data that, because it is gathered from actual industrial accidents and hazards, is generally trusted. In contrast, the nature of cost engineering information makes data highly sensitive, and therefore usually confidential. This results in QRA inputs usually being determined solely through interviewing experts and project team members, which means they are often seen as subjective or biased. A key challenge for risk managers is to structure, consolidate and exploit the internal feedback data used for risk analysis so that the outcomes are trusted.
Inputs to the @RISK model
For most projects, PragmaRisk models the risks related to the budget and schedule overrunning, taking this integrated approach because cost and time are interdependent, and result in the most indirect costs.
Typical inputs to a Cost and Schedule Integrated QRA include:
- Simplified Cost Breakdown Structure (CBS), showing how much is expected to be spent on each element of a project.
- The sensitivity of key costs. For example, procurement of industrial equipment and materials depends on the market conditions for raw materials and prices can change by the time purchase orders are placed. When historical data is available, some probability density functions (that determine previous patterns) can be derived and exploited.
- Simplified Schedule. This is the plan of a project’s key constituent tasks, showing those that are critical to the process, with sensitivity / range analysis of their durations and the way these are linked (ie the knock-on effect that each has on the other).
- List of risks / opportunities that could impact the project. Ideally these are taken from a specific risk analysis performed on the project, combined with historical information of similar projects.
- 'Risk mapping' ensures consistency and analyses the interdependencies between the inputs in order to ensure no important correlations are missed and to avoid ‘double dips’ and omissions. (A detailed screening of the risk register ensures issues have not been omitted. At the same time, to avoid uncontrolled cumulative effects, it must be factored in that several risks might impact the same individual cost item or scheduled task.)
Bruno Berroyer
PragmaRisk
@RISK outputs
Running a Cost and Schedule Integrated QRA using @RISK, PragmaRisk typically first identifies the probability of meeting the estimated budget if there is no contingency fund. This will depend on how the budget has been calculated, with factors such as estimator practices, company culture and the aggressiveness of assumptions influencing the figure:
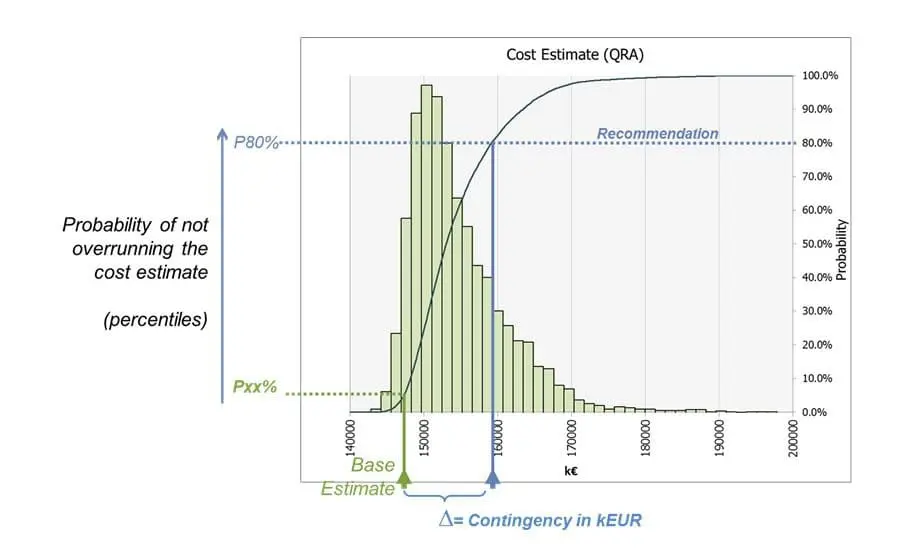
From there it can be determined how much contingency budget is required to ensure the required level of ‘risk comfort’. This is expressed as the percentage likelihood of not overrunning the cost estimate. For the purpose of budget, when projects are in their early stages, most companies use percentile 50%. This is the median value, and is regarded as a realistic forecast that also avoids ‘killing’ projects before they have been studied sufficiently (Class 5 to Class 3 as per AACE cost estimate classification guidelines).
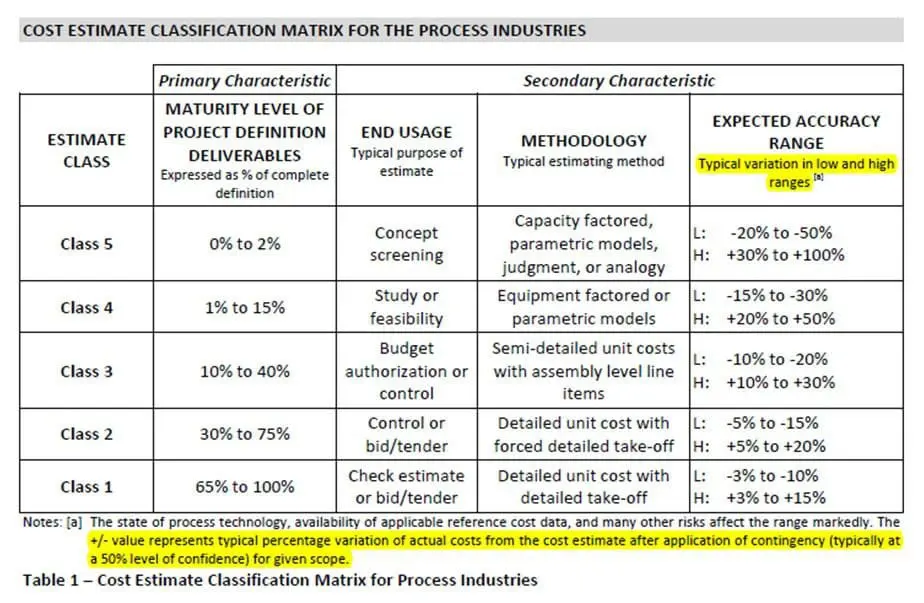 Source: AACE Cost Estimate Classification System – Recommended Guideline 18R-97
When the scope of work and risks are better defined and understood, percentiles 70% or 80% are traditionally used. By this stage, companies are committed to success and wish to secure their financial forecast. However, an engineering and construction contractor bidding for a new project must make its tender competitive, and might price aggressively (while ensuring this is consistent with its own ‘strategy’ and ‘risk appetite’).
A 'P80' rating indicates that there is an 80% chance of being on or below budget, while a P60 shows a good degree of confidence and a P50 is ambitious but realistic about the budget being met. Pricing aggressively, for example to win a contract for strategic reasons, might see a P30 figure.
The amount of contingency selected for the project will depend on its risk profile, but also on the contractor’s ’risk appetite. Using a Monte Carlo approach does not predict what will actually happen, but it applies reasoning under conditions of risk and uncertainty so that these two key aspects to be distinguished. However, because of the nature of risk this does not always produce satisfactory results. While some researchers try to remove ‘unknown risk events’ and ‘black swans’ via their QRA models, PragmaRisk focuses on the operational aspects of a project and the need to accept working with uncertainty. A project outcome that falls outside the contingency figures forecast is regarded as a learning opportunity to analyse whether a different approach should be taken in future.
Finally, the main uncertainties and risks affecting the budget of the project can be outlined. This allows mitigating action to be taken to reduce risks where possible. It also provides a complementary view to the usual ‘Top-Risks’ identified by qualitative risk analysis. This increased coherence between qualitative and quantitative risk management provides a wider view of the project and related risks.
Building project risk profiles
Monte Carlo simulation is not the only method with which to determine and monitor contingency. In some circumstances, for example if time or the resources available are limited, or for projects undertaken by small to medium sized companies, a detailed 'risk register' and / or Monte Carlo risk analysis are usually not feasible because no dedicated resource or risk manager is available.
In these instances, an alternative, 'parametric' approach can easily and efficiently provide a risk profile for each new proposal or project using both qualitative and quantitative risk management information. PragmaRisk uses Palisade's StatTools (also part of the DecisionTools Suite) to analyse the historical data for portfolio projects and produce typical overruns / contingency consumption curves in line with a project’s specific risk profile.
Qualitative risk management uses a scoring mechanism to profile projects based on key risk drivers. These include the country where it is to be carried out and the context in which the client operates there, contractual and financial terms, complexity and technology challenges, the basis of the estimate / proposal preparation (for example, whether the contractor has had enough time to research constituent costs), the aggressiveness of cost and schedule assumptions, execution plan sourcing and subcontracting constraints.
From a quantitative perspective, the parametric approach provides a view that complements the traditional 'expert judgment' contingency recommendation method. This tailors typical contingency curves built from StatTools, using the accounting project risk profile and current context (ie: the risk drivers, physical progress, etc).
The completed risk profile highlights areas on which to focus and the risks to be mitigated.
StatTools also allows advanced analysis of feedback data, which enables the relationship between the qualitative risk profile of projects and their financial performance to be determined. Details examined include the extent of overruns as a function of a project's physical progress (ie: to flag accuracy issues), the overall effect of each risk driver and the correlation between them.
"Widely-used and well-maintained and supported"
"Widely used around the world, Palisade's software is well-maintained and supported, which means we can introduce risk analysis to our clients that have never undertaken QRA, or have had poor experiences in the past. Even for clients who use ERPs (enterprise resource planning software) rather than Excel, Palisade Custom Development can also deliver," Berroyer concludes.
Most useful software features:
- Good integration with Microsoft Excel and Microsoft Project
- Wide variety of input models available in @RISK
- Wide variety report and graph formats to show outputs
- Integration between statistical software (StatTools) and probabilistic software (@RISK)
Specific techniques used for quantitative analysis
- Integrated Cost and Schedule Risk analysis: Excel, MSProject or exploiting Primavera schedule and risk analysis
- Matching historical data with the ‘best-fit’ curve
Distributions used
- For Cost Engineering applications, PragmaRisk usually uses bounded continuous functions. It chooses distributions that will allow it to better capture ‘expert’ views (from the engineering, procurement, construction, project management teams, etc) to ensure a close match between what is stated and what is incorporated into the model. (Experience shows that practitioners can, unintentionally, provide inputs that are biased).
- As recommended by AACE (formerly the Association for the Advancement of Cost Engineering), PragmaRisk mainly uses double triangular distributions which are ‘4 points’ distribution (minimum, mode, maximum, probability not to overrun the mode). This gives more control than traditional triangular ‘3-points’ distributions, especially for very asymmetric ranges (ie: -2% / +10%).
- When more ‘points’ are required, ‘Artist’ fitting functions are used to strictly capture expert views.
- When structured feedback data is available, we use fitting functions to generate the most appropriate probability density functions.
- On occasion a risk requires a specific approach, PragmaRisk selects one of the other continuous functions available from the extensive @RISK library.
- PragmaRisk also uses ‘discrete’ function to model whether or not a risk event will occur


