









Key takeaways
Framework analysis is a structured, matrix-based qualitative research method developed by Jane Ritchie and Liz Spencer at the UK's National Centre for Social Research for applied and policy research. It follows five stages—familiarization, identifying a thematic framework, indexing, charting, and mapping and interpretation—and its defining feature is a matrix that arranges cases in rows against themes in columns, so researchers can compare across participants systematically. Because it combines predefined and emergent themes, it suits research with clear questions, multiple cases, and a need for a transparent audit trail. NVivo Desktop's Framework Matrix, now available on Windows and Mac, is purpose-built for the method's most labor-intensive step: charting. NVivo AI Cloud supports the stages around it, from AI-suggested initial topics for your thematic framework to cross-case matrices for mapping and interpretation.

What is framework analysis?
Framework analysis is a systematic, matrix-based approach to qualitative data analysis that organizes cases against themes so researchers can compare findings across participants while keeping a clear, documented trail back to the original data.
The method was developed in the 1980s by Jane Ritchie and Liz Spencer from the Qualitative Research Unit at the UK's National Centre for Social Research (NatCen), originally to support applied social policy research. It later became especially prominent in multi-disciplinary health research, where teams needed a way to analyze large qualitative datasets—often collected by different researchers—while still producing findings that policymakers and stakeholders could trust.
What sets framework analysis apart from other qualitative methods is the framework matrix: a table where each case (a participant, site, or unit of analysis) occupies a row, each theme occupies a column, and each cell holds a summary of that case's data on that theme.
This structure is what makes the method's biggest strength possible: transparency. Every step is documented, every summary traces back to coded source data, and multiple researchers can review or replicate rigorous qualitative analysis without guessing how a conclusion was reached.
That transparency is exactly why applied researchers, especially in qualitative health research, reach for framework analysis. When findings need to hold up in front of funders, government bodies, or clinical review boards, an audit trail isn't optional—it's the difference between a defensible conclusion and an anecdote.
In summary, framework analysis:
- Is a qualitative method for analyzing data using a case-by-theme matrix
- Was developed by Ritchie and Spencer at NatCen for applied policy research
- Combines predefined (deductive) and emergent (inductive) themes
- Is designed to be transparent, comparable, and auditable
When should you use framework analysis?
Framework analysis works best when you have defined research questions, multiple cases to compare, and a need to show your analytical process clearly to others. It's less suited to research that's purely exploratory or aimed at generating new theory from the ground up.
Because the method starts with a structure—even if that structure evolves—it's a strong fit for applied and policy research, team-based projects where consistency across coders matters, and studies where stakeholders will expect to see how a conclusion was reached. It's a weaker fit when the goal is deep, single-case interpretive analysis, or when researchers want maximum flexibility to let entirely new theoretical categories emerge without a starting framework.
| Use framework analysis when… | Consider another qualitative method when… |
|---|---|
| You have defined research questions to answer | Your goal is open-ended theory generation (→ grounded theory) |
| You're comparing multiple cases or participants | You need deep interpretive depth on a single case |
| A team of researchers is coding together | One researcher is working alone with full interpretive freedom |
| Stakeholders need a transparent audit trail | Flexibility matters more than structure |
| Findings need to inform policy or practice | The research question itself is still being defined |
As with other qualitative analysis methods, framework analysis isn't without tradeoffs. Because the framework is built early and applied systematically, there's a real risk of locking themes in place before the data has fully revealed itself—flattening nuance in service of structure.
Researchers who use the method well treat the framework as a living document, refining it as familiarization and indexing surface new patterns, rather than treating the first draft as final.
Framework analysis vs. thematic analysis
Framework analysis is best understood as a structured, comparative form of thematic analysis. Both methods identify themes in qualitative data, but framework analysis adds a matrix output and a more explicit, auditable process.
Thematic analysis as a qualitative research practice gives researchers latitude to let themes emerge organically and to interpret data with fewer procedural constraints.
Framework analysis narrows that flexibility in exchange for consistency: every case is examined against the same themes, and the resulting matrix makes cross-case comparison and reporting more direct.
| Dimension | Framework analysis | Thematic analysis |
|---|---|---|
| Structure | Highly structured, five defined stages | Flexible, fewer prescribed steps |
| Output | Case-by-theme matrix | Coded themes, often narrative write-up |
| Inductive/deductive | Combines both from the outset | Can be fully inductive or fully deductive |
| Best for | Applied research, multiple cases, teams | Exploratory or interpretive research |
| Audit trail | Explicit and built into the method | Depends on researcher's documentation |
| Flexibility | Lower—framework guides the process | Higher—themes can evolve freely |
If your research calls for open-ended theme development without a matrix structure, our guide to thematic analysis covers that method in depth. Framework analysis is the better choice when you need the comparative structure a matrix provides.
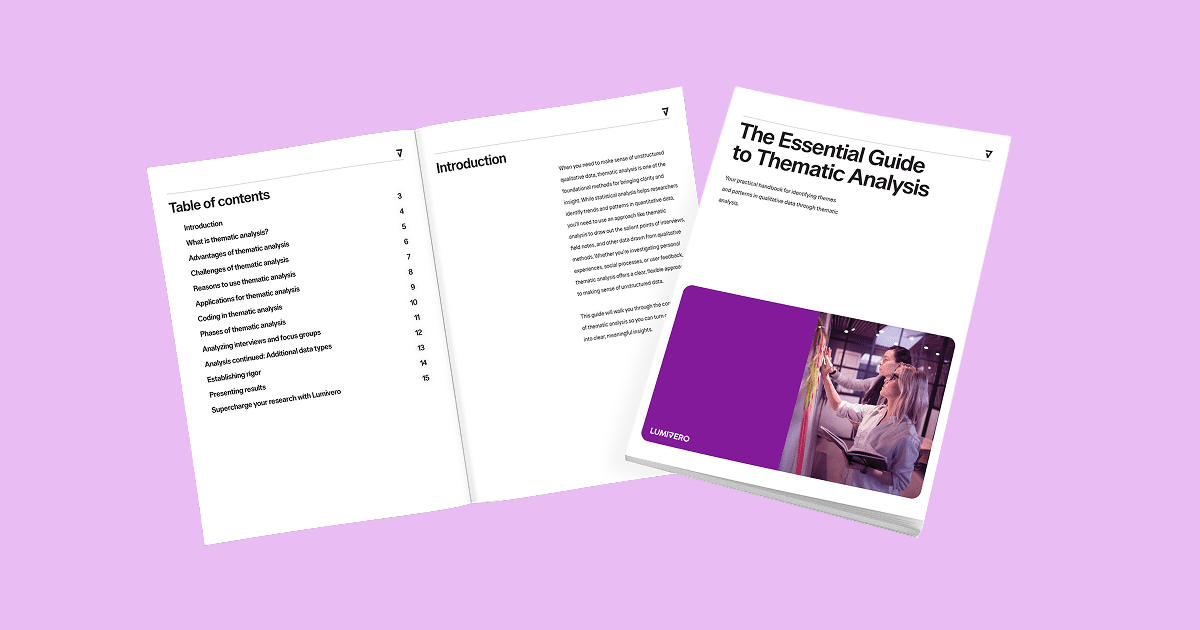
Want to dig deeper into thematic analysis?
Learn how to identify meaningful patterns in qualitative research with “The Essential Guide to Thematic Analysis."
Download eBook →The five steps of framework analysis
The framework method follows five sequential but iterative stages: familiarization, identifying a thematic framework, indexing, charting, and mapping and interpretation. In a framework analysis process, each stage builds on the last, though researchers often revisit earlier stages as understanding deepens.
The five steps of framework analysis are:
- Familiarization—immerse yourself in the raw data and note early impressions
- Identifying a thematic framework—build a deductive-and-inductive index of themes
- Indexing—apply the framework systematically across all data
- Charting—summarize indexed data into the case-by-theme matrix
- Mapping and interpretation—read across and down the matrix to find patterns
1. Familiarization
Familiarization means immersing yourself in the raw data before attempting to analyze it. Read and re-read transcripts, field notes, and other source material involving textual data to understand the breadth of what participants said and the context behind it.
This stage isn't just passive reading. Researchers typically jot down preliminary ideas and initial impressions as they go—early notes that will directly inform the themes identified in the next stage. Skipping or rushing familiarization is one of the most common ways researchers undermine the rest of the process.
2. Identifying a thematic framework
This stage builds the index of themes that will eventually become the columns of your matrix. Key themes come from two directions: some are predefined based on the research questions (deductive), and others emerge directly from the data during familiarization (inductive).
The resulting framework doesn't need to be perfect on the first pass. It's a working structure that gets tested—and refined—once you start applying it to real data in the next stage.
3. Indexing
Indexing is the systematic application of your thematic framework across the entire dataset. Every relevant piece of data gets coded to the theme (or sub-theme) it corresponds to, ensuring consistent treatment across all cases.
This is where consistency matters most, particularly for teams. If different researchers are indexing different transcripts, clear, explicit code definitions are what keep the resulting analysis comparable.
4. Charting
Charting is the stage where indexed data gets summarized into the framework matrix itself: cases in rows, themes in columns, and each cell holding a condensed summary of that case's data for that theme. It's the step that gives framework analysis its name and its defining structure.
Charting is also, by a wide margin, the most labor-intensive step in the method. Done by hand, it means manually re-reading indexed excerpts for every case-theme combination and writing a concise, accurate summary for each cell—work that scales directly with the number of cases and themes in a study. This is precisely where software built for the task earns its keep, a point we'll return to below.
5. Mapping and interpretation
With the matrix populated, mapping and interpretation is where analyzing qualitative data pays off. Researchers read across rows to compare themes within a case, and down columns to compare a single theme across all cases, looking for patterns, associations, and explanations that answer the original research questions.
This is the step where the structured groundwork of the previous four stages pays off. Because every case has been summarized consistently against the same themes, patterns across the dataset are visible in a way that's difficult to achieve with unstructured qualitative notes.
A worked example: Framework analysis in practice
To make the method concrete, here's a fictional, illustrative example—not a real study—showing how framework analysis might move from indexed data to a filled matrix to an interpretation.
Imagine a research team studying patient experience across three outpatient clinics. Their research questions focus on communication, wait times, and follow-up care. After familiarization with interview transcripts, the team builds a thematic framework with those three themes as starting columns, then indexes each transcript accordingly.
The resulting matrix might look like this, with each cell holding a condensed summary of that case's coded data for that theme:
| Case | Communication | Wait times | Follow-up care |
|---|---|---|---|
| Clinic A | Patients felt informed at each visit; staff explained next steps clearly | Frustration with delays over 30 minutes; several missed other appointments | Follow-up calls were consistent and appreciated |
| Clinic B | Mixed reports; some patients felt rushed during explanations | Wait times generally short; minimal complaints | No follow-up contact reported by any patient |
| Clinic C | Patients described communication as thorough but overly clinical | Long waits were common but tolerated due to staff friendliness | Follow-up occurred only when patients initiated contact |
Reading down the "follow-up care" column reveals a pattern the team might have missed case by case: follow-up is inconsistent across all three clinics and, where it happens at all, it's often patient-initiated rather than proactive. That single observation—visible only once the matrix made cross-case comparison possible—becomes a concrete, evidence-backed recommendation for the clinics involved.
How to run framework analysis in NVivo AI Cloud and NVivo Desktop (the Framework Matrix)
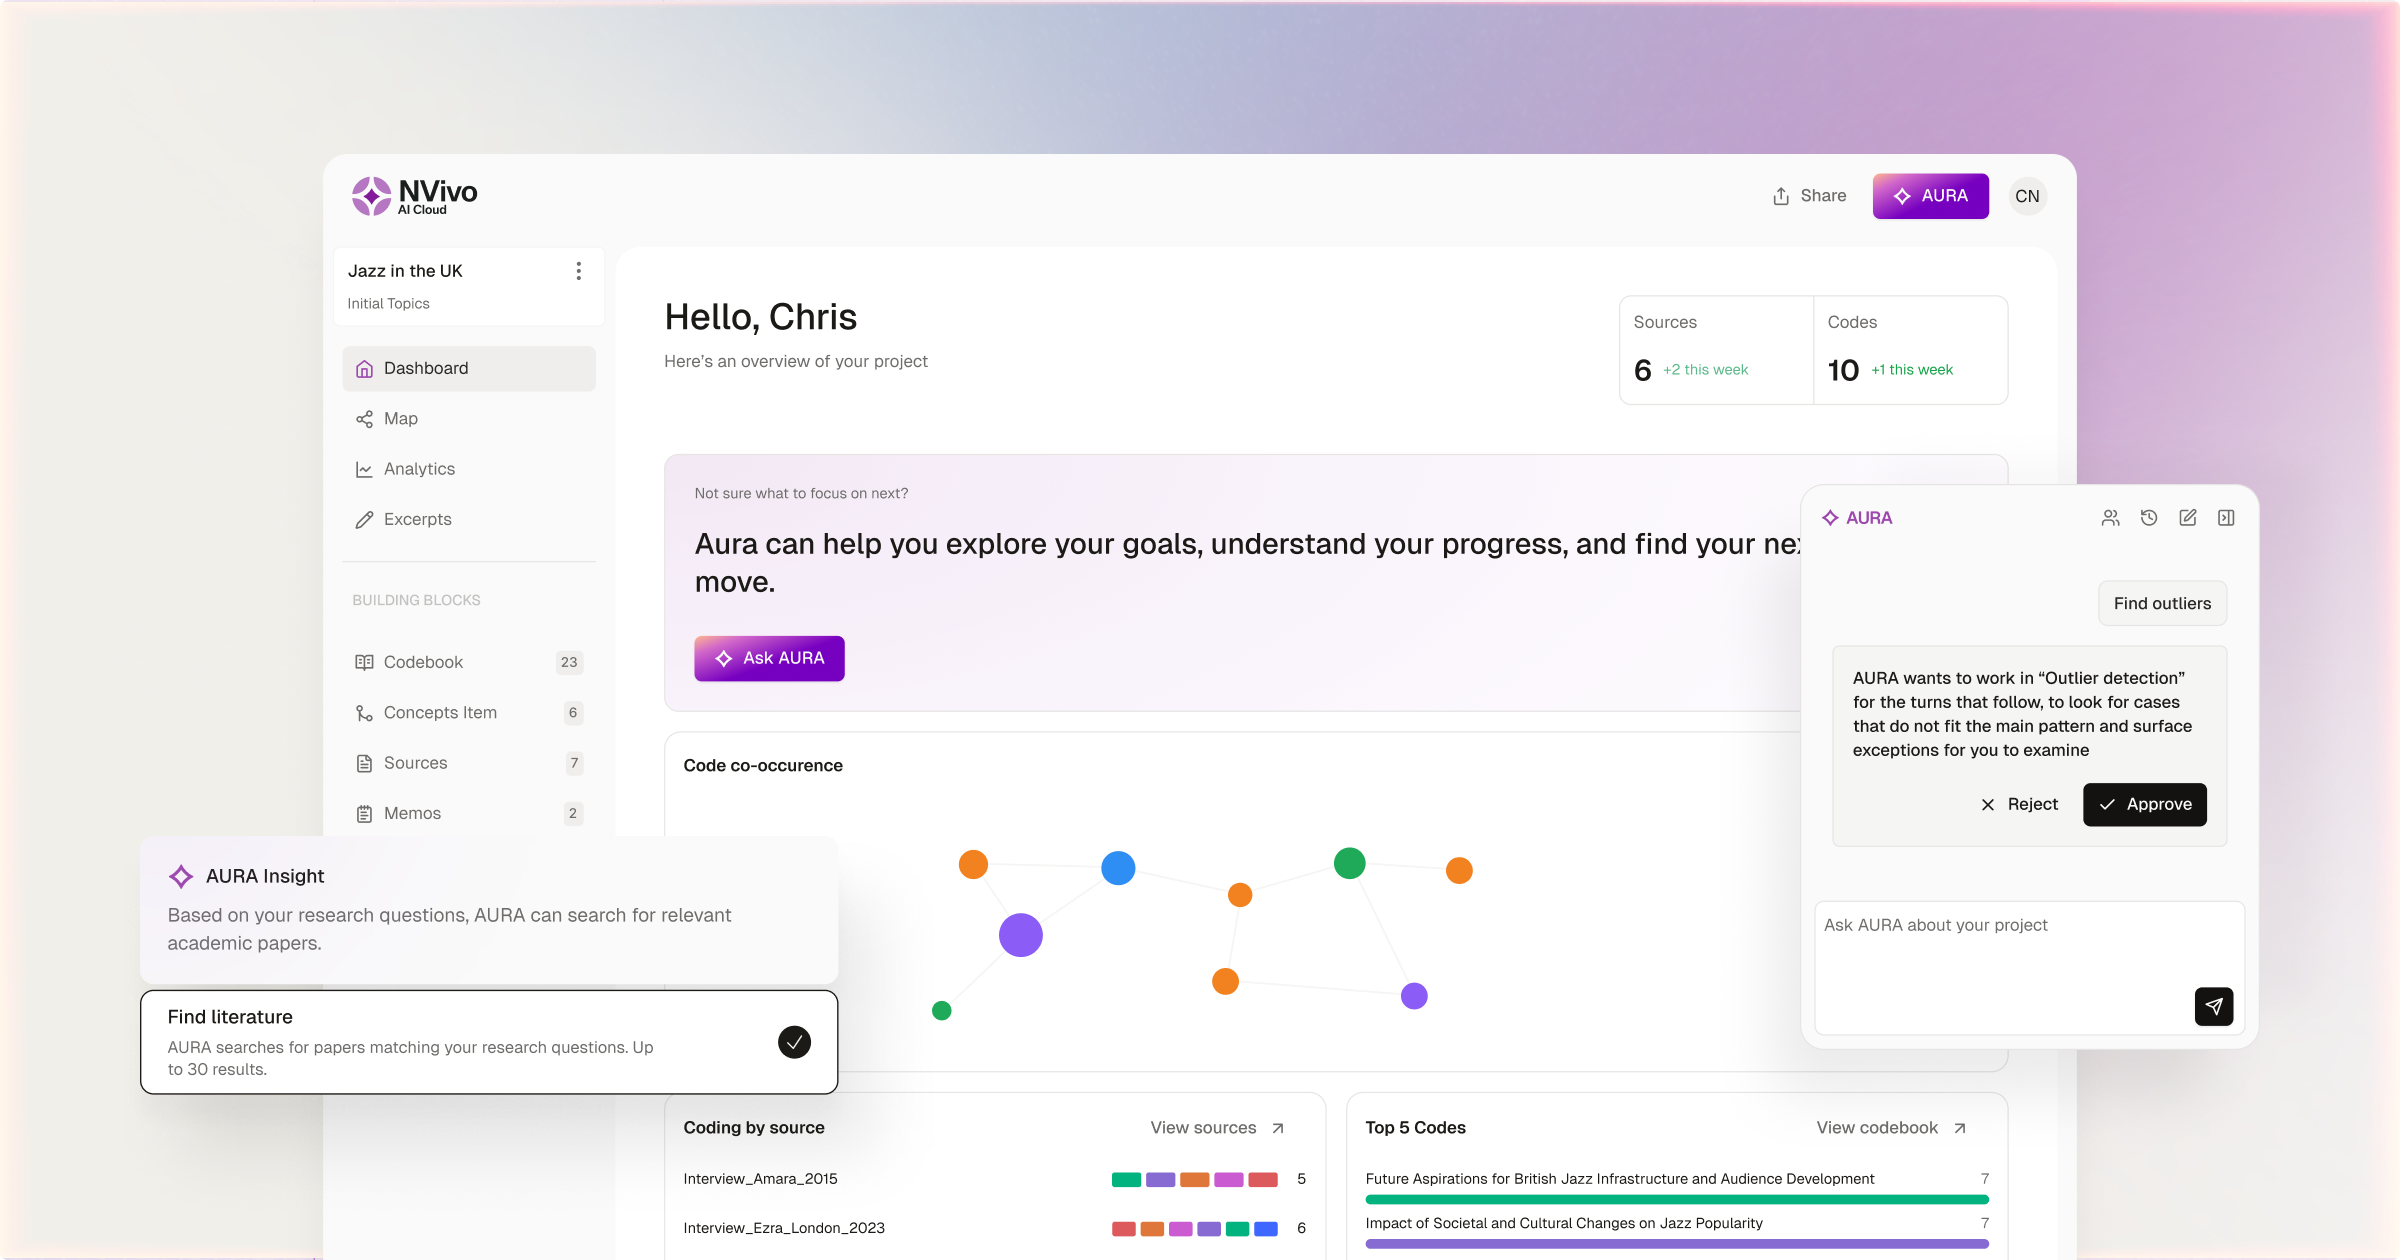
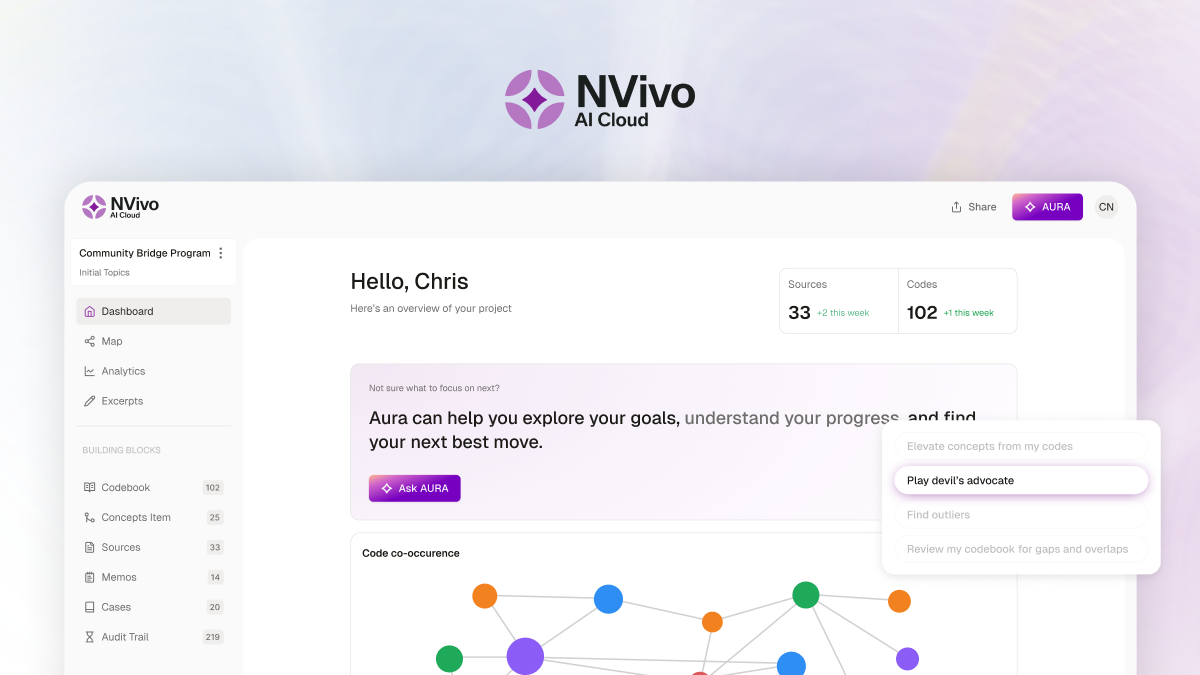
NVivo AI Cloud, Lumivero's AI-native, cloud-based research environment, supports framework analysis while you stay in charge of the method. AURA—NVivo AI Cloud's AI-powered Unified Research Assistant—helps at four points:
- Identifying a thematic framework: AURA identifies broad initial topics across your sources with the supporting excerpts attached. Combine them with the themes your research questions predefine, or specify your own initial topics and ask AURA to code for them.
- Indexing: Write a definition for each code, apply codes yourself, or let AURA auto-code against the topics you confirm, with every AI suggestion approved by you.
- Charting: Organize participants with cases and variables, and ask AURA for a comparison table of cases against themes with supporting quotes and citations, which you can send to a memo to review and refine.
- Mapping and interpretation: Code × Variable and Code × Code matrices show where themes concentrate across participant groups and where they overlap, and AURA's Devil's Advocate and outlier prompts look for disconfirming evidence and cases that don't fit.
NVivo Desktop’s Framework Matrix is a purpose-built feature for the charting stage of framework analysis, letting researchers build a case-by-theme matrix directly from their cases and coded data—available on both Windows and Mac
Setting one up starts with cases and themes you've likely already established earlier in your project: cases (participants, sites, or other units of analysis) become the matrix rows, and theme codes—the codes you developed during indexing—become the columns. From there, you write each cell summary yourself while viewing the underlying coded excerpts in a side-by-side preview, keeping the connection to source data visible throughout.
To see how NVivo's AI Assistant stacks up against best AI tools for academic research more broadly, check out our full comparison.
And that's where NVivo Desktop's Framework Matrix earns its place. Charting by hand means writing a fresh summary for every case-theme intersection in a study—work that grows quickly as cases and themes multiply. NVivo Desktop's Framework Matrix doesn't remove that analytical judgment, builds the structure for you: the matrix comes directly from your cases and coded themes, and the original coding stays visible beside each cell for verification
Once populated, matrices export cleanly for reporting and write-up, giving researchers a publication-ready, auditable summary of their cross-case analysis rather than a set of disconnected notes.
Ready to put framework analysis into practice?
Buy now →Framework analysis best practices and tips
Framework analysis rewards discipline, but a few common missteps can undermine even a well-designed study.
- Don't lock the framework too early.
Treat your initial thematic framework as a draft; revisit and refine it as indexing surfaces patterns you didn't anticipate. - Keep indexing consistent across a team.
Define codes explicitly and check for drift between researchers, especially on larger, multi-coder projects. - Watch for over-summarizing in cells.
A chart cell should condense data, not strip away the nuance that made it meaningful in the first place. - Never lose the link back to raw data.
Every summary should be traceable to its source excerpt so findings can be verified or revisited. - Pilot the framework before full-scale indexing.
Testing it against a handful of cases first catches structural problems before they multiply across the dataset. - Maintain a documented audit trail throughout.
This is the feature that makes framework analysis defensible to funders, reviewers, and policymakers—don't treat it as an afterthought.
Frequently asked questions
Framework analysis is a qualitative method, though its matrix structure supports systematic comparison across cases. It's often used in mixed-methods studies alongside quantitative analysis.
It was developed in the 1980s by Jane Ritchie and Liz Spencer and colleagues at the UK's National Centre for Social Research (NatCen), originally for applied social policy research.
The five steps are familiarization, identifying a thematic framework, indexing, charting, and mapping and interpretation.
Framework analysis is a structured, matrix-based form of thematic analysis. It uses a defined framework and a case-by-theme matrix for transparent cross-case comparison, while thematic analysis is generally more flexible and interpretive.
A framework matrix is a table that arranges cases in rows against themes in columns, with each cell summarizing that case's data for that theme. It's the core analytical output of framework analysis. In NVivo, the Framework Matrix builds this structure directly from your cases and coded themes, with optional AI-assisted cell summaries.
Yes. NVivo Desktop's Framework Matrix is purpose-built for the charting stage, letting you summarize coded data by case and theme, then export the result for reporting. NVivo AI Cloud supports the stages around it: AURA suggests initial topics for your thematic framework with supporting excerpts attached, and cross-case matrices help you read across participants, while you apply the method yourself.
Use framework analysis for applied research with defined questions and multiple cases where you need comparison and an audit trail. Choose grounded theory when the goal is to build new theory inductively, without starting from a predefined structure.