









Executive summary
The 2025 Global State of Experiential Learning Report captures the perspectives of faculty, program chairs, deans, and systems administrators across the United States and the United Kingdom, offering a detailed view into how institutions are managing, measuring, and modernizing their experiential learning (EL) programs.
The findings surface a clear pattern: while most institutions report confidence in their current processes, deeper analysis reveals significant blind spots—particularly around insight generation, data access, and system efficiency. Many programs have digitized, but few have optimized.
Key insights:
- Platform adoption is high—but insight remains elusive.
– 66% of institutions use an experiential learning platform, but 25% still rely on spreadsheets, email, and phone calls to manage key processes. - Access to data is not the same as access to insight.
– 90% of respondents can access student performance data, yet competency attainment remains the most difficult metric to track and report on. - Accreditation preparation is a major time drain.
– More than 50% of respondents spend 10–15 hours per week compiling documentation for accreditation—a process often still manual and fragmented. - Multi-tool workflows limit efficiency.
– Despite most institutions using 2–3 tools to manage placements, only 17% called their systems “moderately efficient or inconsistent,” revealing a gap between perceived and actual efficiency. - The insight gap is growing.
– While many programs believe their systems support strategic decision-making, most still struggle to access critical insights like competency attainment, supervisor engagement, and long-term outcome trends. - The future hinges on smarter systems.
- From performance tracking to accreditation readiness, institutions that turn data into actionable insight will be best positioned to grow, improve, and lead.
Introduction: The digital plateau
Experiential learning has become a cornerstone of higher education. But after years of effort to digitize placement processes and modernize tracking systems, momentum has stalled. Most institutions have made the leap to digital—but not to insight.
The 2025 Global State of Experiential Learning Report reveals a striking contradiction: while the majority of programs feel confident in their current systems, deeper data shows those systems are failing to uncover critical insights—like competency attainment, placement quality, and accreditation evidence—that are essential to driving program improvement and proving impact.
The result? Functional programs that lack visibility. Confident teams operating without clarity. And institutions that are unintentionally underutilizing the data they already collect.
The central theme is clear: you don’t know what you don’t know. And that’s the missed opportunity. Programs that have adopted centralized, integrated systems are already unlocking new value—measuring impact more effectively, scaling with less friction, and closing the loop between placement activity and student success.
This report surfaces where programs stand today, what’s holding them back, and how the next wave of growth will be powered—not just by going digital—but by transforming data into actionable insight that drives student and institutional success.
The efficiency illusion
Most institutions feel their placement processes are effective—but that confidence is built on manual workarounds that strain staff and limit access to critical insights.
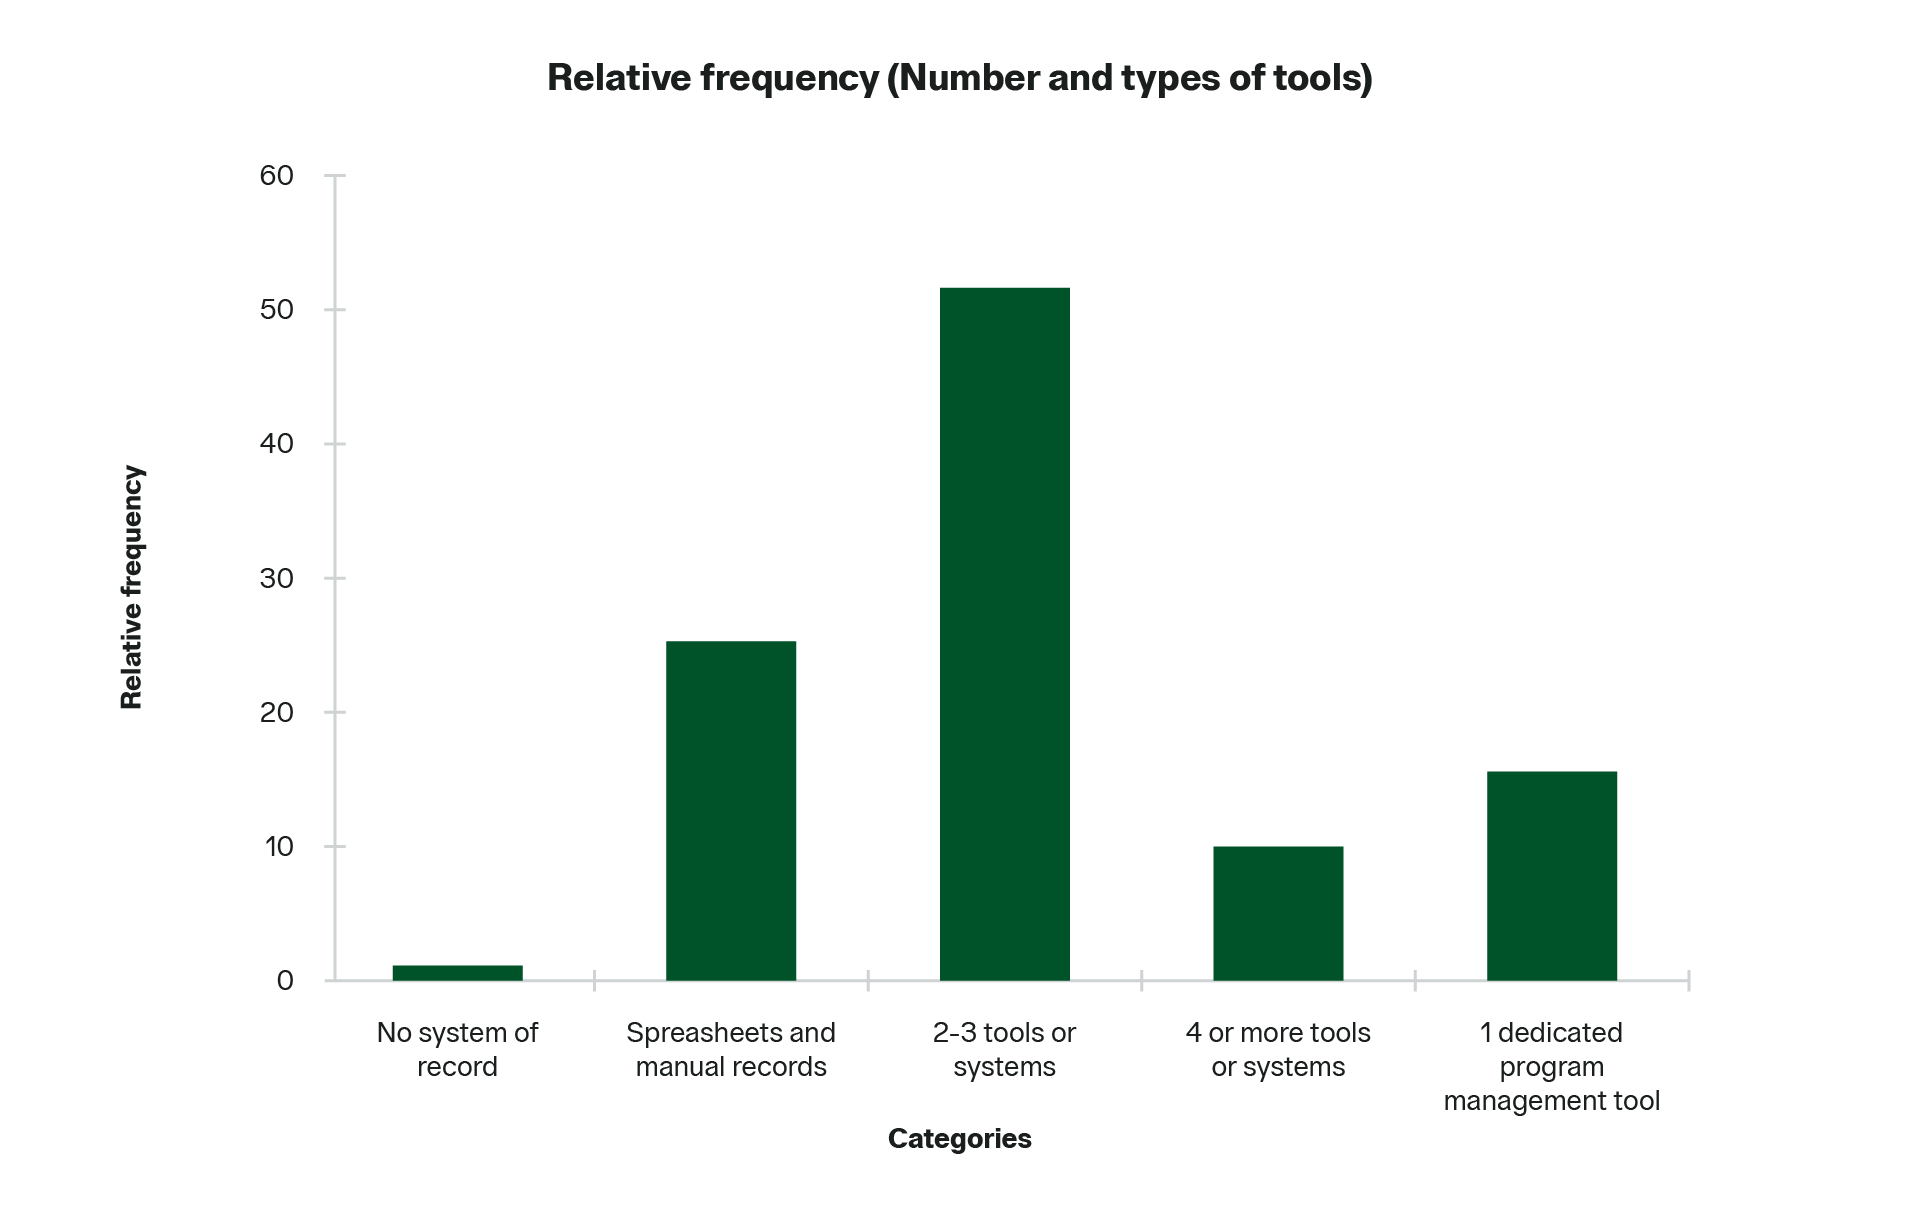
83% of respondents rate their systems as “highly” or “fairly efficient,” even as most continue to juggle multiple disconnected tools. Multi-tool workflows are the default as most programs manage placements with 2–3 different systems, many of them manual.
These findings indicate that institutions have normalized workarounds and adapted to fragmented systems rather than solving them. And the consequences are clear: critical insights like student progress, competency attainment, and supervisor engagement remain some of the hardest data points to access for 90% of institutions.
Key insights:
- 90% report difficulty accessing key insights such as student progress, competency attainment, and supervisor engagement.
- 83% of institutions describe their process as efficient, yet partially rely on manual, multi-tool workflows.
- 25% of programs still use spreadsheets, phone calls, and email to manage core workflows.
The insights gap
While many programs feel confident that their systems support strategic decision-making, a closer look reveals a disconnect: the insights they need remain difficult to access.
Competency attainment, student progress, and supervisor engagement top the list of insights respondents struggle to extract—a concerning gap, given how essential these metrics are to program quality and accreditation readiness.
This challenge is often rooted in fragmented reporting. Data lives in spreadsheets, emails, and isolated systems that don’t speak to each other—making it difficult to form a complete picture. Without consistent access to these core metrics, institutions risk making decisions without a full picture of what’s working—and what isn’t.
Key insights:
- All respondents struggle to access at least one of these critical insights: student progress, supervisor engagement, competency attainment, accreditation readiness, or outcome trends.
90% of institutions have real-time access to student performance and progress across placement—but still struggle to access the data that matters most.
Competency attainment is the most difficult insight to extract, even in well-established programs. - All respondents struggle to access at least one of these critical insights: student progress, supervisor engagement, competency attainment, accreditation readiness, or outcome trends.
- 90% of institutions have real-time access to student performance and progress across placement—but still struggle to access the data that matters most.
- Competency attainment is the most difficult insight to extract, even in well-established programs.

Reporting fatigue
Reporting remains one of the most fragmented and manual aspects of experiential learning administration. Most programs still compile reports using a mix of spreadsheets, email, and standalone documents—typically spread across 2–3 tools. As a result, student progress, accreditation readiness, and student competency and performance reports require significant effort to produce and are often stitched together from disconnected sources.
This fragmented approach slows down insight and introduces inconsistency. While reporting is happening, it’s often time-intensive and reactive, rather than integrated and strategic. Teams spend more time gathering and formatting data than analyzing it—making it difficult to track progress over time or draw clear connections between placements, outcomes, and program impact.
Key insights:
- 50% of programs build reports manually using 2–3 tools or spreadsheets.
- When asked to select all that apply, respondents building reports manually cited competency attainment (60%), student progress (50%), supervisor engagement (40%), outcome over the years (40%), and accreditation readiness (35%) as the most time-consuming to create.
- Reporting is fragmented across formats and systems, with performance data often split between departments.
- Staff report spending the most time compiling insights on student progress, supervisor evaluations, and competency attainment.
"We spend the most time manually compiling reports on student progress across placements, competency attainment, and supervisor evaluations, often combining data from multiple systems and formats.”
—IT/Systems Administrator, Counselling/Psychology Program, 151-300 students, USA

Measuring impact: What matters most to each program
When asked how they currently measure the success of their experiential learning programs—and how they’d prefer to measure it—respondents revealed a clear desire to go beyond basic metrics. While most institutions track completion rates and enrollment, many want a more holistic view of impact that reflects career readiness, student experience, and employer satisfaction.
Social work programs stand out for their emphasis on student/employer feedback, with 70% identifying it as a preferred success metric—and that’s how most are already measuring success today.
Teacher education programs continue to prioritize student completion rates, with 57% of respondents favoring it as a core metric, and 59% are already using it to measure program success.
Counseling and psychology programs see supervisor or employer feedback as a key measure of success—but while 76% prefer this feedback as a core metric, only 62% are currently tracking it. Interest is also growing in tracking outcomes like career success and placement evaluations.
Key insight: Programs want to evolve how they measure success—but they need systems that can support more dynamic, outcome-driven metrics.


Accreditation's administrative weight
Accreditation remains a critical responsibility for experiential learning programs—but while systems are partially automated, the systems supporting it are still largely manual, inconsistent, and disconnected.
Staff spend hours compiling documentation from multiple systems to meet accreditation requirements, often without the benefit of automation or integration. While most institutions provide digital records of field experience, 32% still create paper/manual reports or leave students to track the information on their own.
This fragmentation limits visibility and turns compliance into a time drain rather than an opportunity for program insight.
- 66% say that their process for preparing for accreditation reviews is “highly to partially manual.”
- 54% of respondents report learning outcome documentation as the most time-consuming or stressful accreditation preparation task.
- Nearly 50% of respondents spend 10–15 hours per week tracking accreditation evidence.
- 32% of institutions either produce a paper or manually created report for students, or none at all.
"It's time—[it takes] a long time to collect [everything] together before input, and processing, again, takes time."
—Dean, Counselling/Psychology and Social Work programs, more than 300 students, US


The cost of keeping up
Running an experiential learning program is a high-touch, high-pressure operation—and in many institutions, it’s being held together by a patchwork of tools, siloed systems, and time-consuming manual tasks.
While many programs consider their processes efficient, nearly every function—from site coordination to assessment reporting—places a consistent burden on staff. At least 24% of respondents rated every core task as time-consuming, suggesting the work gets done, but often at the expense of innovation and long-term improvement.
Manual systems don’t just slow teams down—they limit visibility, reduce collaboration, and strain capacity. These challenges reflect a broader pattern: programs running on outdated processes that appear functional but are burning resources to stay afloat.
Key insights:
- 24% of respondents listed every core task as time-consuming.
- High-effort tasks span the entire placement lifecycle—from contract setup to competency reporting.
- Manual processes are common across facilitating communication, collecting paperwork, and student progress tracking.
“It mandates a time of intense concentrated activity at the beginning of each semester that can add to the level of stress for those responsible.”
— Program Chair/Coordinator, Teacher Education Program, 300+ students, USA

Dean’s perspective: Leadership without visibility
Even at the highest levels, experiential learning leaders are feeling the strain. Deans and directors report spending significant time on manual reporting, student tracking, and accreditation documentation—critical work that remains far from streamlined.
Program data is often scattered across systems, making it difficult to compile, analyze, or share in a timely way. The result is a leadership team focused more on gathering information than using it to drive improvement.
“I often have to spend a lot of time just compiling and analyzing students' respective grades and averages each quarter in order to accurately track their academic performances over time.” — Dean/Director, Teacher Education Program, 300+ students, USA
“I have a hard time building reports for each student over years if they had gone through a different system or school. It takes a while to get permission to transfer data and assign it in records.” — Dean/Director, Counselling/Psychology, Teacher Education, and Social Work Programs, 151–300 students, USA
These aren’t isolated frustrations—they reflect a broader issue: insight gaps aren’t just operational, they’re strategic. Without connected systems, even institutional leaders struggle to see or communicate the full impact of their programs.
Evolving programs, expanding potential
Experiential learning programs aren’t just preparing to grow—they’re looking to improve. Most institutions expect moderate to significant expansion in the coming years, alongside increased resource allocation. But growth alone isn’t the goal. Institutions are also focused on improving outcomes, streamlining operations, and demonstrating institutional value.
To meet these goals, institutions are turning to technology—not just to manage more placements, but to make smarter decisions, support students more effectively, and report progress with confidence. Tools like centralized data tracking, student experience records, and supervisor collaboration are emerging as core priorities—not add-ons.
Key insights:
- Most institutions expect moderate to significant program growth and increased resource allocation.
- 56% listed centralized data tracking as one of the top tools for meeting next year’s goals and priorities.
- 72% of teacher education programs expect to “grow significantly or moderately” in the next 2-3 years, with a majority expecting additional resources to support expansion.
- 91% of social work programs anticipate “significant to moderate growth,” with the majority expecting additional resources to support expansion.
- 90% of counseling and psychology programs expect to “grow significantly or moderately” in the next 2-3 years, the most of all three programs surveyed, and expect additional resources to support expansion.
"A centralized system that tracks and visualizes outcomes like competency attainment, employment data, supervisor feedback, and placement quality combined with real-time dashboards and alumni tracking would significantly improve our ability to demonstrate program value.”
—IT/Systems Administrator, Counseling/Psychology Program, 151-300 students, USA

Next steps in experiential learning
Most experiential learning programs already have the data they need—but that data is often locked inside spreadsheets, scattered tools, and manual processes. What’s missing isn’t information—it’s insight.
The path forward isn’t about starting from scratch. It’s about building on what’s already working—and removing the friction that holds progress back.
Key moves forward:
- Audit your current data processes. Where are time and effort being lost—and what is it really costing you? Download the “Experiential Leaning Tech Stack Checklist” to uncover the hidden inefficiencies draining your team’s capacity and slowing your program’s momentum.
- Prioritize tools that centralize, connect, and scale as your program grows.
- Shift from reactive reporting to real-time program intelligence.
- Invest in systems that help you not just measure outcomes—but improve them.
Supporting the next phase of growth
At Lumivero, we’ve built the Experiential Learning Cloud to support this next phase. It brings placement data, competency tracking, supervisor feedback, and accreditation evidence together to create a single source of truth—helping programs spend less time compiling and more time improving.
Download the "2025 Global State of Experiential Learning Report" or request a demo of Experiential Learning Cloud to start improving student and program outcomes.
Appendix: Analysis methodology and tools
The analysis presented in the “Global State of Experiential Learning Report” was conducted using a combination of statistical and qualitative tools to ensure rigor and depth in the interpretation of results.
Quantitative data analysis was carried out using XLSTAT, Lumivero’s statistical and data analysis solution designed for applied research. The open-ended questions were coded by themes using NVivo, Lumivero's qualitative data analysis software built to support qualitative and mixed methods analysis. Cross-comparisons were made between the themes and the closed-ended questions and by sector.
Cross-disciplinary analysis team:
- Silvana di Gregorio PhD, Product Research Director and Head of Qualitative Research, Lumivero
- Fabien Llobell PhD, Head of Quantitative Research, Lumivero
Technical writer and editor: Abigail Jacobsen, Content Marketing Manager at Lumivero.
Tool citations:
Lumivero (2025). XLSTAT statistical and data analysis solution.
https://lumivero.com/products/xlstat/
Lumivero (2025). NVivo qualitative data analysis software.
https://lumivero.com/products/nvivo/