


Key takeaways
Monte Carlo simulation in @RISK can model a system as complex as the 48-team 2026 World Cup by combining historical data with carefully chosen probability distributions for variables. Whether you're forecasting a tournament bracket or a multimillion-dollar project, modeling a complicated system can produce results that sharpen your thinking and decision-making.
The World Cup is one of the most popular sporting events on the planet. According to FIFA, 1.5 billion viewers tuned in for the 2022 men’s final, making it the most-watched World Cup match in history. And every four years, fans everywhere try to forecast how their team will fare. Methods include everything from gut instinct to elaborate spreadsheets to Paul the Octopus, the oracle in a German aquarium who correctly predicted the winners of eight matches in 2010.
Paul is a hard act to follow. But there are more rigorous—and more repeatable—ways to model uncertain outcomes. That's where @RISK comes in.
Professor Steve Begg of the University of Adelaide has spent his career studying decision-making under uncertainty in oil and gas, and as a long-time @RISK user, he knows how to put that expertise to work. Since 2018, he's applied his uncertainty modeling skills to an entertaining side project: simulating major football tournaments with @RISK, including the 2018 and 2022 World Cups and the English Premier league. Prof Begg’s work has even been compared with Paul the Octopus in The Australian newspaper. This article looks at his simulation of the 2026 World Cup—and what it can and can't tell us about what might happen on the pitch.
Want to see Prof. Begg walk through his predictions for the final? Watch his webinar, “Football World Cup 2026: Calculating Accurate Outcome Probabilities.”
How the World Cup tournament works
To appreciate the complexity of this modeling problem and its implications, it helps to review how the World Cup is structured. The tournament is split into two stages: a group stage and a knockout stage.
In the group stage, teams are sorted into groups of four. Each team plays the other three in its group, earning 3 points for a win and 1 for a draw. The teams are then ranked by highest points, and if there are any ties, goals scored and then goal difference are used to separate them. There are over 36 trillion unique permutations of how the teams could be ordered at this stage! The top two teams from each group advance to the knockout stage, where the matchups are pre-determined by the FIFA rules. From there, it’s single-elimination football until one team lifts the trophy.
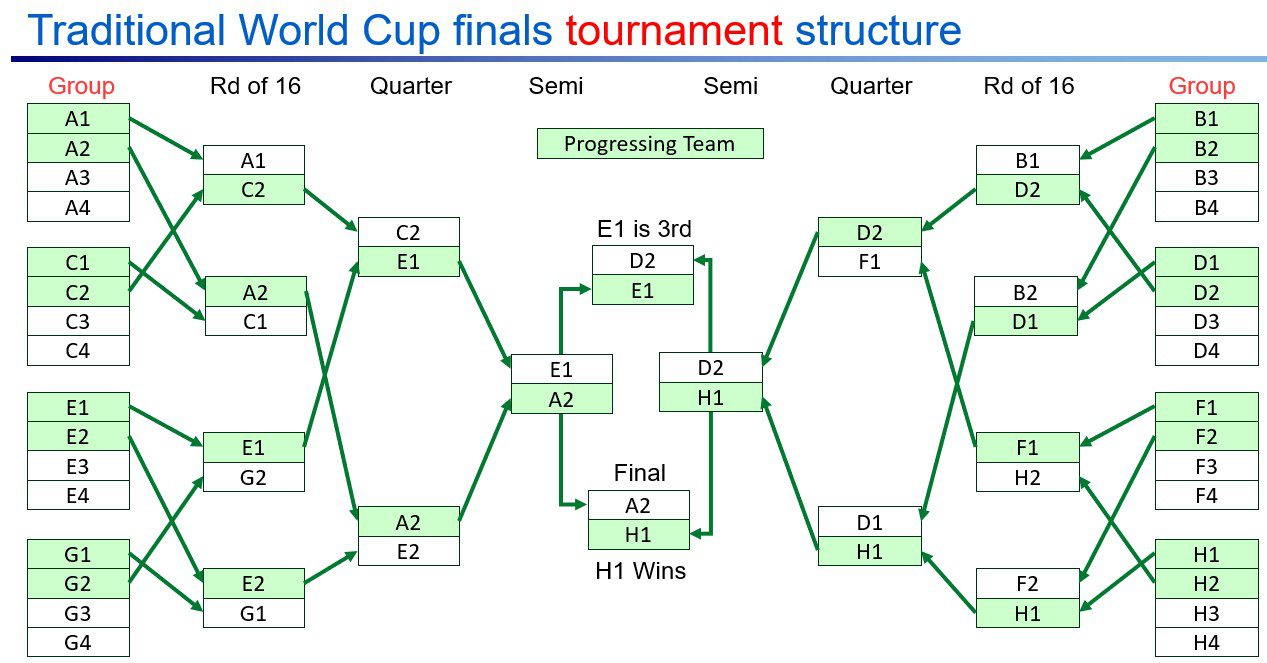
Traditional tournament structure of the World Cup finals
The 2026 tournament adds another layer of complexity, because the tournament has expanded the field from 32 teams to 48, with the eight best third-place teams also going through to the knockout phase. More teams mean more groups, more matches, and much greater complexity—there are 495 possibilities of how those eight third-placed teams might be allocated to opponents.
A team’s progression doesn’t just depend on how well they play
Tournament complexity, combined with extreme sensitivity to goals scored, is what makes the outcomes so unpredictable. A single goal could switch a team from third-, or even fourth-, place to being the winner or second in their group, which has a knock-on effect on which bracket they appear in and who their opponent will be.
Another key factor in how a team progresses is the initial group they are allocated to. Some groups are a lot “tighter” in terms of the abilities of the teams, notably the three groups that contain the host nations—this levels the playing field somewhat, increasing the chances that any of the 12 teams could progress through to the knockout.
The consequence of this complexity is that just making a statistical assessment of the outcome of each match, based on historical data, is insufficient to assess the probability of how a team will progress through the competition.
Here's how Prof. Begg approached building a model that could handle it.
Setting up the field: Identifying variables and assigning distributions
Building a Monte Carlo model starts with three questions:
- What are we trying to understand?
In this case, which teams are most likely to win their matches and, for the group stage, how many goals will be scored for and against? - What are the key uncertain variables?
Three key factors stand out: each team’s average performance throughout the tournament, match-specific deviation from that performance and the total number of goals scored in any given match. - What data do we have to inform the probability distributions assigned to those variables?
For team performance, recent world rankings are a good starting point (the results of historical match-ups between any two teams are largely irrelevant because teams change significantly over time and there are very few, if any, recent match-ups). For goals, there are decades of match data from which to assign the total number of goals scored in any game.
From there, two performance measures were developed for each team:
- Tournament form, based on historical FIFA ranking-points, with its uncertainty expressed as a PERT distribution. This captures how strong a team is going into the tournament, based on its track record. Prof Begg proposes that the top-ranked FIFA teams have a greater chance of playing less well than their current form, and a lower chance of performing even better—hence the PERT is skew to the left. The opposite is proposed for the lowest ranked teams, so their PERTs are skew to the right.
- Match form, also expressed as a PERT distribution. This accounts for random variations that occur from match to match—poor referee decisions, player injuries, adverse weather, luck and the other intangibles that can decide an outcome.
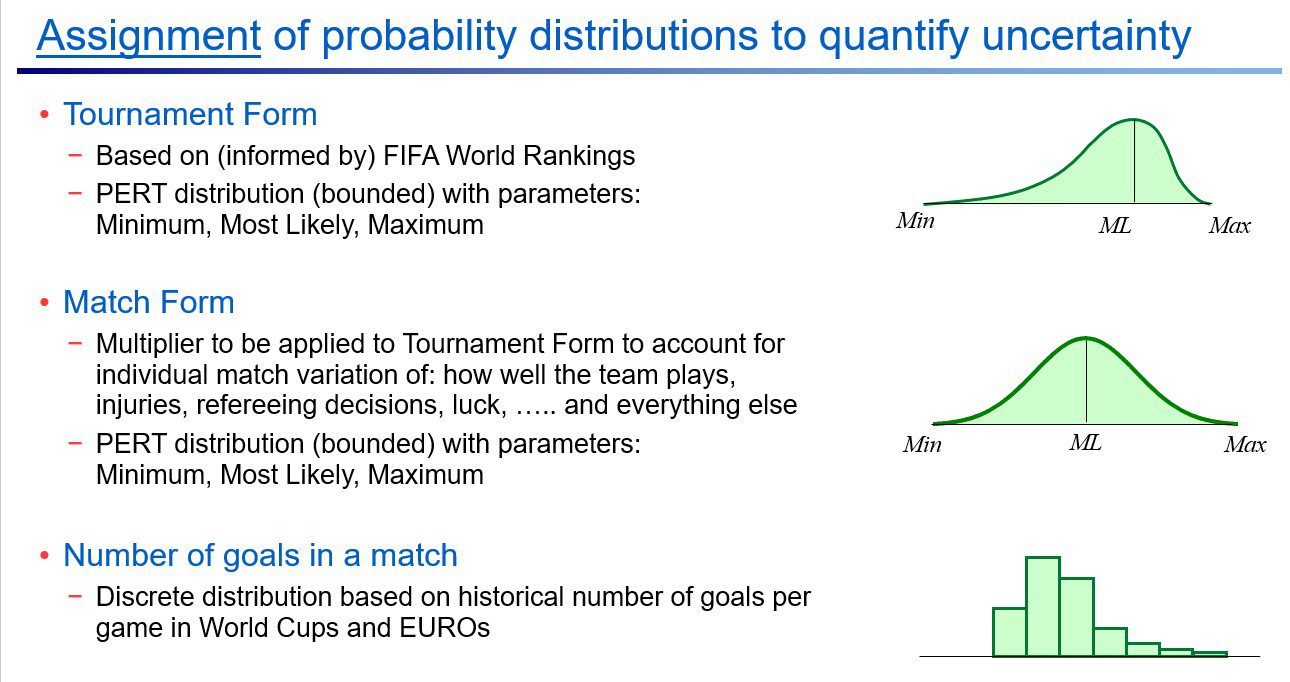
The six matches in each group were set up in Excel along with the FIFA rules and logic needed to correctly rank them based on the scores in each match. The score in any given game is determined by allocating the total goals in a match according to the ratio of the two teams match forms. Then the FIFA rules were implemented for which teams should progress to the knockout phase and how the match-ups should be allocated in each bracket. Most of the match-ups are pre-determined (e.g., Winner Group F vs Second in Group C) but the allocation of the eight third-placed teams depends on which one of the 495 possibilities actually occurs.
Probability distributions for the Tournament Forms, Match Form and Total Goals per Game were set up in @RISK and the simulation was run 100,000 times. In any one iteration, a team’s Tournament Form was kept constant for each match in that iteration. However, their Match Form was varied for each match by multiplying the Tournament Form by a factor drawn from the Match Form distribution.
Make smarter decisions under uncertainty
Football is a fun way to explore Monte Carlo simulation—but the same principles drive decisions worth billions across finance, energy, and beyond. Download “The Guide to Intelligent Decision-Making Across Project Portfolios,” to see how.
Download eBook →The results
The results of simulating the expanded 48-team tournament produces a clear picture of which teams are most likely to go deep—and where the real uncertainty lies. The overall probability of winning is shown in the chart.
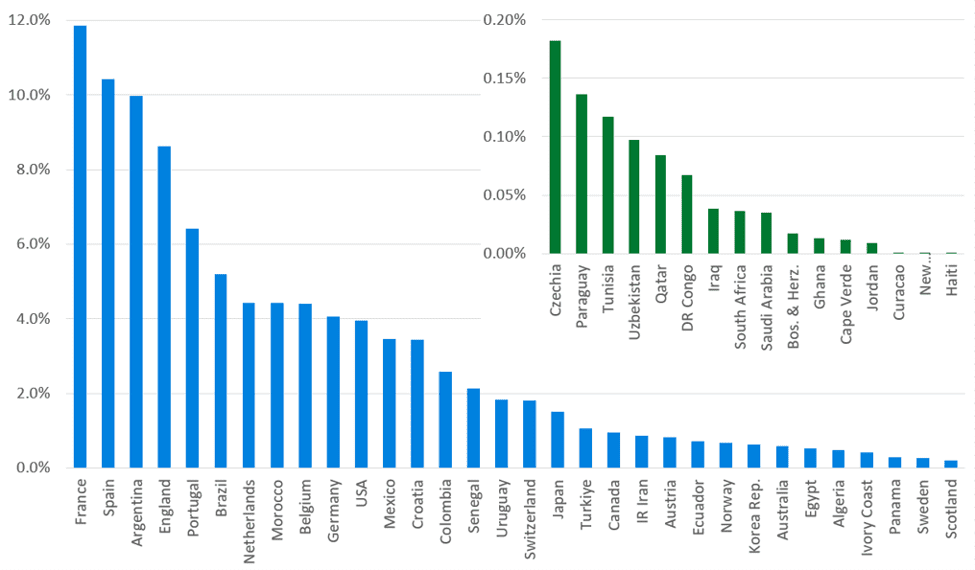
Probabilities of winning the 2026 World Cup
The top four highest probabilities are France, Spain, Argentina, and England, which broadly agrees with fan sentiment, but remember, France’s 11.9% chance of winning means there is an 88.1% they won’t. Also, the absolute probabilities may be lower than popular opinion and England’s probability may seem high to the non-partisan. The next grouping is Portugal, Brazil and Netherlands, and so on. The hosts USA and Mexico have a higher chance of winning than their FIFA ranking suggest, in part due to home advantage, expressed through a small increment to their tournament form.
For the first four groups, the probabilities of progressing through each stage of the competition are shown in the table. All groups are shown at the end of this article.
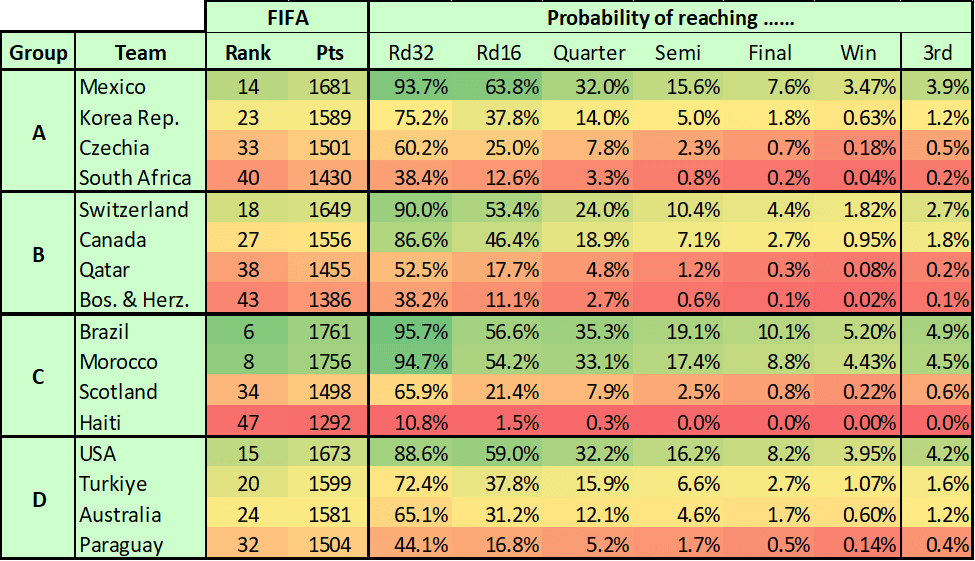
The group stage tells its own story. A single goal in this stage can reshape the tournament by throwing up unlikely match ups and shifting teams from one side of the bracket to the other. This is what makes it so hard to predict. There is also the possibility of major “giant- killing” upsets, which do occur in the simulation, but because they are unlikely, they are “hidden” in the overall probabilities.
Is this World Cup model “accurate”?
This is the question most people ask—and it's worth answering carefully, because it gets at something fundamental about how probability works.
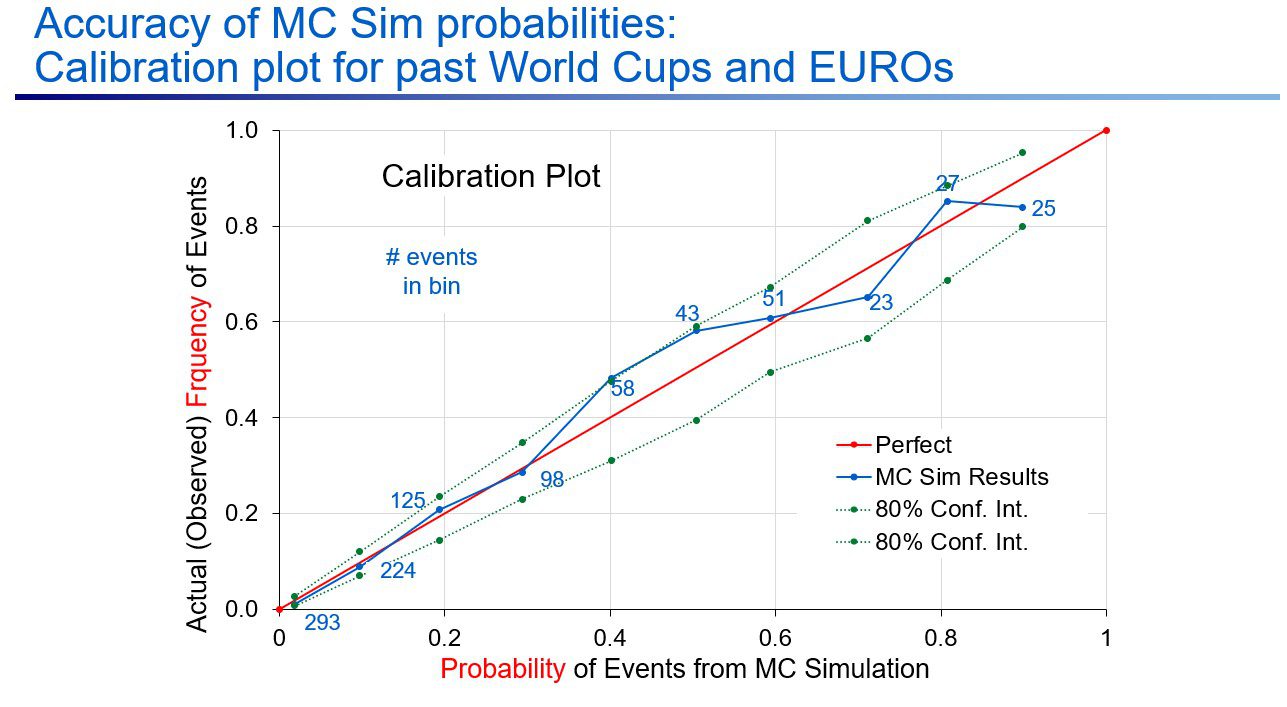
Probabilities quantify uncertainty. It’s not possible to judge the accuracy of a probability calculation from a single outcome. To evaluate a probabilistic model, you need to compare the frequency of multiple outcomes at a given probability over many trials
For example, if you take all events (example event: “USA progresses to the first round of the knock-out phase”) that have an approximately 0.3 probability, the model is accurate if about 30% of the time the events actually occur. Then you need to repeat this for all other probabilities between 0 and 1 and plot the outcome frequencies against the calculated probabilities. The results would plot on a straight line for a perfectly calibrated model.
Prof. Begg has done this using the outcomes of the 2018 & 2022 Men’s World Cup, the 2020 & 2024 EUROS, and the 2023 Women’s World Cup. There are not a lot of high probability events, so we would expect more deviation from the straight line for these probabilities. To account for the number of events at each probability level, Prof. Begg has added an 80% confidence interval. If the probabilities are accurate, we would expect the observed frequency to lie outside these intervals about 2 out of 10 times.
A common mistake people make with probability is treating it as prediction. They expect a good model to tell them who is going to win, and when it doesn't, they conclude the model was wrong. And they often forget a basic rule: the probability of an event not occurring is 1 minus the probability that it will. So if there is a 10% chance a team will win the World Cup, there is a 90% chance they won’t!
Another mistake is believing that there is a single “right” probability. As Prof. Begg explains, probabilities represent your degree of belief that an event will happen—so different people with different information can, legitimately, assign different probabilities (so long as their reasoning is not biased). The variables you identify, the data ranges you use, and the distributions you choose all reflect the modeler's judgment and the information available at the time.
Even though probability is a function of the information you have, not an intrinsic property of the world, a simple model of the uncertainty in a complicated real-world system can produce accurate and interesting results with @RISK—results likely to spark some lively conversations at your World Cup watch party.
Ready to model your own uncertain outcomes?
Whether you are forecasting a tournament bracket or a capital project, @RISK helps you see the full range of outcomes—not just a single best guess. Buy @RISK or explore Lumivero’s decision solutions to see what Monte Carlo simulation can do for your decisions.