










Key takeaways
When average liking scores look flat, clustering analysis often reveals deeper insights about which consumers want what and why. Using K-means clustering and preference mapping, it is possible to develop a smarter portfolio strategy that hit higher consumer preference across multiple markets without increasing the number of SKUs, as exemplified in Perrot et al., 2018.
For multinational food and beverage companies, one challenge looms large: how do you sell into markets with wildly different taste preferences?
The traditional answer—gather sensometric data from each market and tailor a recipe to suit—has obvious appeal. It also has a hidden cost. A dozen markets can quickly mean a dozen recipes, each with their own supply chains and production lines.
There's a smarter approach. By analyzing consumer preference data globally and using clustering to identify patterns that cut across geography, product developers can often meet diverse market needs with a far more limited portfolio.
The approach was the subject of a recent Lumivero webinar led by two sensometrics experts: Nicolas Pineau of Swiss firm DataInsight, co-author of a 2018 study on multi-market preference mapping published in Food Quality and Preference, and Fabien Llobell, data and analytics expert at SensElevation (and former Head of Quantitative Research at Lumivero). Together, they walked through a real-world clustering analysis case study—and showed how XLSTAT can streamline the entire workflow inside Microsoft Excel.
Watch the webinar on demand or read on for the highlights.
What is preference mapping?
Preference mapping is a statistical method that helps sensory researchers understand how a product is perceived in a given market. There are two main types:
- Internal preference mapping identifies which consumers like which products most. Data typically comes from consumer panels who try to rate a set of products.
- External preference mapping identifies which product characteristics—sensory attributes like taste or mouthfeel, or marketing-based attributes like packaging or price—consumers respond to most strongly.
XLSTAT lets researchers run both types of preference mapping analysis directly within Excel, with no need for a separate software stack.
Coffee mixes in Asia: Designing a multi-market study
The case study Pineau walked through centered on Nestlé coffee mixes. The brand was selling three different recipes across three key Asian markets but was struggling to push preference above 50% against local competitors. The goal: find a way to refine the product portfolio so that 80% of the consumers can find their favorite product on the shelves while keeping the product portfolio to a minimum number of SKUs across all three markets. The study recruited 135 consumers in each of the three markets, for 405 participants in total. Each tested eight coffee mixes:
- Nestlé leading product in each market (A, B, and C)
- The top competitor in each market (Ax, Bx, and Cx)
- Two new prototype recipes (P1 and P2)
Data came from overall liking score on a scale of 1–7 as well as open comments about likes and dislikes, plus a sensory profile that asked an expert panel of 12 panelists to rate each product on a scale of 0–10 across a range of attributes.
In the original paper, the team chose internal preference mapping. The advantage of this approach was that the resulting maps would be only triggered by what consumers actually liked—keeping the analysis consumer-centric rather than sensory- or demographic-centric. With that design, the team set out to answer four questions:
- How do current products perform, and what do consumers like?
- Do all consumers like the same products?
- Why do consumers like the products they like?
- Based on the answers above, what's the best portfolio strategy?
Smarter segmentation with K-means clustering
Customer segmentation often relies on averages, but averages can hide as much as they reveal. K-means clustering goes deeper. It's a machine learning algorithm that's increasingly used for market segmentation, image compression, and document clustering. XLSTAT users can run it directly inside Excel.
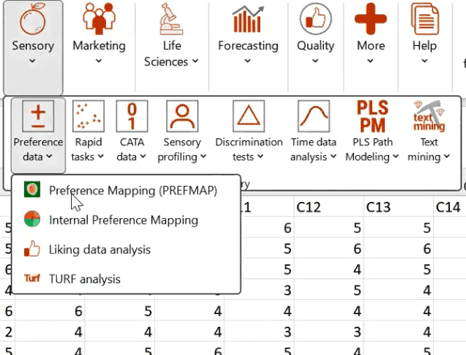
The analysis followed five steps:
- Principal component analysis (PCA). XLSTAT generates a variables map showing how consumers group around different product characteristics.
- K-means clustering. Select the data, define labels, and run the algorithm.
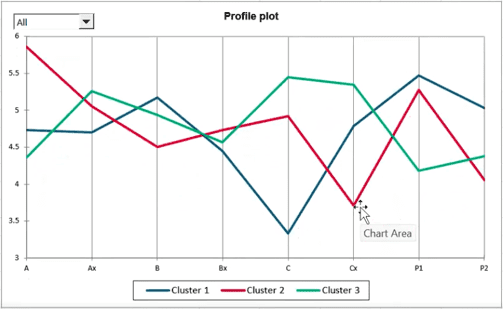
- Review initial results. Inertia and silhouette evolution plots indicate where a meaningful number of clusters emerges. For the cappuccino data, both plots pointed clearly to three clusters.
- Inspect detailed reports. See which clusters were largest, which consumers were strongly attached to a cluster, and which sat "on the bubble" between two. The profile plot—showing mean liking scores per cluster per product—is one of the most useful visuals XLSTAT produces for sensory researchers.
- Liking data analysis. Generates cluster-by-cluster breakdowns including means charts, box plots, ANOVA results, and biplots that show how assessors group around products.
What the data revealed
At the aggregate level, the data suggested there wasn't enormous variance in how much participants liked the products.
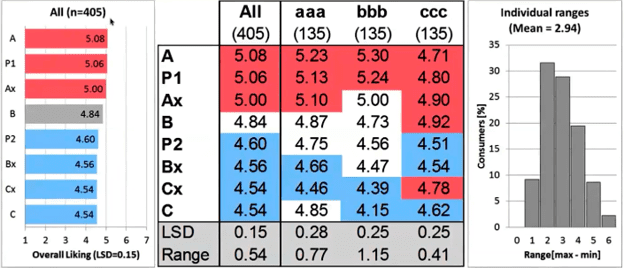
The cluster maps told a very different story: within each cluster, there were clear winners and clear losers. The analysis also linked product preference to specific sensory attributes. In cluster 1, for example, preference for prototype P1 correlated with high ratings on "roasted" and low ratings on "sweet."
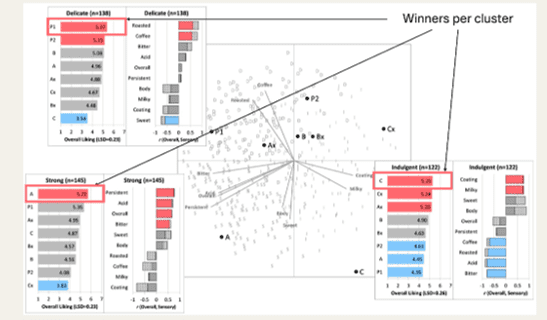
Those insights translated into a concrete portfolio strategy:
- Prototype P1 would replace Product B, which had no strong backers in any cluster.
- Product A would be reformulated to have a stronger coffee taste, the attribute its supporting cluster rated highest.
- Product C would be adjusted to feel more velvety and indulgent, in line with what its cluster preferred most.
When the clusters were broken back out into individual markets, the team noticed something else: each market had a strong second-place preference, and that runner-up was also a Nescafé product.
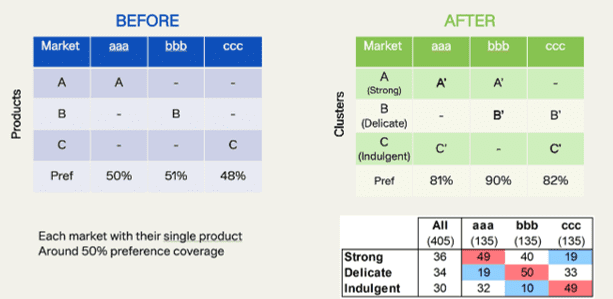
By offering two products in each market—guided by the cluster data rather than market-by-market reformulation—Nestlé reached its 80% preference target without producing a new recipe for each region (total number of recipes maintained to 3).
From sensory data to product strategy
Clustering analysis turns liking scores into a roadmap. Instead of chasing local averages, product teams can see the structure underneath—who prefers what, why, and which portfolio combinations can serve the most consumers.
Want to see how clustering analysis could work for your own product portfolio? Explore XLSTAT’s preference mapping, K-means clustering, and the full suite of consumer insights tools available inside Excel, or buy today to get started.