


Risk analysis software may seem like it’s mostly applicable for large financial management firms or for infrastructure projects. However, at Lumivero, we’ve seen customers apply our risk analysis tools across a range of industries including manufacturing, engineering, and even for forecasting annual sales targets.
At the Lumivero Virtual Conference, Jose Orellana, Solutions Consultant at Lumivero, shared innovative ways users are applying @RISK to better predict outcomes, develop contingency plans, and make decisions in many different industries. This article walks through the techniques behind those breakthroughs.
Monte Carlo simulation: A powerful analysis technique
To start, a quick refresher: @RISK functions as a Microsoft Excel add-on, giving users access to a suite of tools for performing Monte Carlo simulation on their models. A Monte Carlo simulation is a data forecasting technique that evaluates the behavior of a complex system—anything from an engineering process to election forecasting—by using random samples. The simulation runs thousands of times, generating probabilities for various outcomes.
Using @RISK for project costing with a risk register
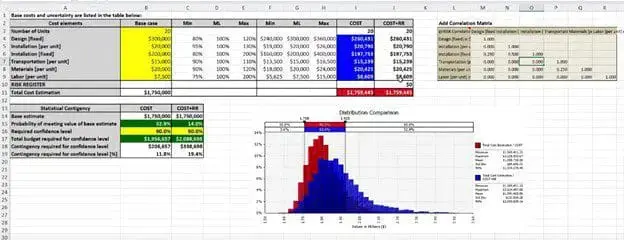
One of the most common applications demonstrated was project cost analysis. By using @RISK to run simulations of a building project, users can:
- Identify which variables most influence risk
- Determine the probability of a project going over budget
- Evaluate the cost impact of items on a risk register
- Set a contingency budget allocation
The process also includes the ability to generate visualizations like histograms and S-curves, which are useful for reporting and presentations.
Aerospace and defense applications: Predicting projectile motion
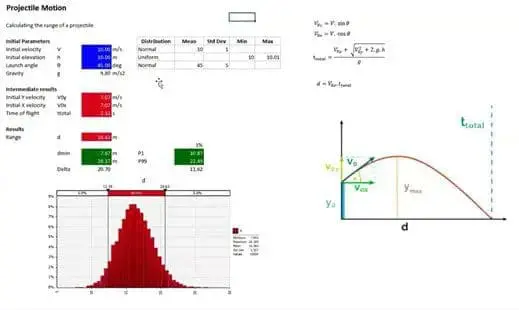
Projectile motion may not be a part of everyday calculations for most professionals, but in sectors like defense and aerospace—or in scenarios where machinery poses a risk of launching objects—it is a critical factor that must be regularly analyzed.
Defense is a sector where Monte Carlo simulation and predictive modeling prove invaluable by informing resource allocation, scheduling, and contingency planning at scale. With @RISK, users can quickly simulate thousands of projectile launches to generate a probability distribution for how far their projectile may travel to determine a safety area. This model can be made as complex or as simple as you need it to be, whether you’re working with a stationary machine sited indoors or a rocket being fired off a mobile launch pad on a windy day.
Oil and gas industry applications: Modeling porosity and water saturation
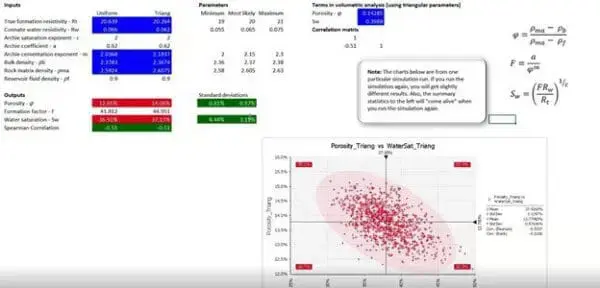
When evaluating an oil or gas reserve, engineers need to consider the porosity of rocks (open space within the rocks) and water saturation (water within those open spaces, as opposed to oil or gas). Industry research has led to the development of a standard equation for evaluating this relationship, known as Archie’s Equation.
By using @RISK, engineers can determine how much water saturation there is likely to be in a reservoir. The calculation shown below uses two distribution models: a uniform distribution and a triangular distribution. However, you can also use @RISK’s distribution fit tool to determine a distribution based on your data. The scatterplot output (lower right) shows the correlation between the two variables.
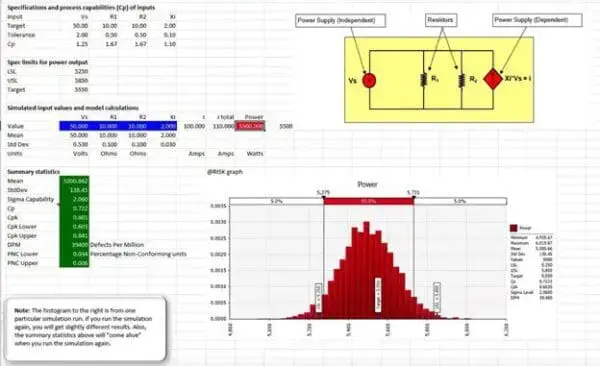
Lean Six Sigma applications: Analyzing an electrical circuit
Six Sigma is a quality improvement methodology that many industries use to reduce defects in their products or processes. @RISK can be used to analyze key statistics commonly applied in Six Sigma quality assessments, including:
- Process capability
- Defects per million
- Percentage of non-conforming products
One particularly useful function is the RiskOutput menu which allows analysts to define the specification limits for a product.
This example shows a Six Sigma analysis of an electrical circuit with a power range of 5,500 watts (W), plus or minus 300 W:
This set of @RISK models helps users:
- Test different components and tolerances
- Determine how well a component is likely to perform
- Determine how many components are likely to be defective
- Identify which factors contribute most to the risk of failure
This helps guide decision making that can improve usable component yields and reduce costs.
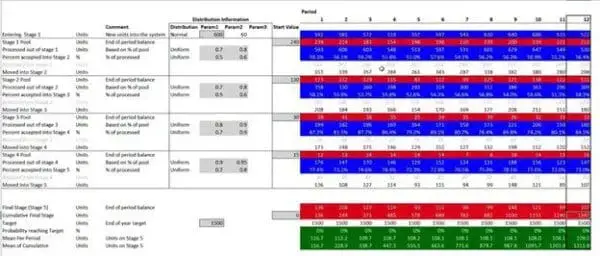
Sales and recruitment applications: Process pipeline modeling
Sales teams and recruiters can model process pipelines with @RISK to forecast year-end results. The software helps estimate the probability of meeting goals at each stage, and the Goal Seek function can identify the number of leads or candidates needed to hit a target.
One example involved a five-step sales process with a year-end goal of 1,500 sales. Simulations showed that the team was unlikely to meet that target without changes. Goal Seek then calculated how many leads per month were needed to achieve a 75% success rate.
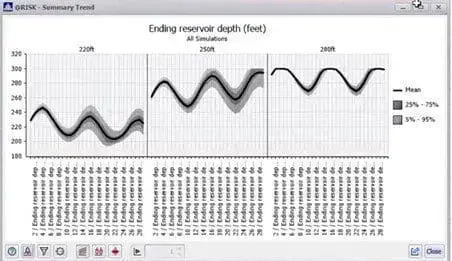
Renewable energy applications: Hydroelectric power generation
Finally, @RISK can also forecast power outputs for a hydroelectric power station based on the water level in the station’s reservoir. This forecast has three main sources of uncertainty: monthly power demand, rainfall, and evaporation.
@RISK’s RiskSimTable function makes it possible to generate models based on multiple starting conditions. Models were run at various starting depths (220 ft, 250 ft, and 280 ft) to compare results. The 220-ft scenario consistently showed higher risk of power shortfall, guiding resource planning.
Make your own breakthroughs with Lumivero
Interested in learning more about how you can apply Lumivero's risk software to guide better decision-making for your industry?


