



Lumivero
Request demo
Buy now

2026 research report

The State of AI in Capital Project Decision-Making

Key findings on how organizations are using—and plan to use—AI to manage capital project risk and portfolio decisions

Survey of capital project professionals 6 industries Lumivero
A high-rise under construction, with a tower crane, rising above low clouds
Download the report

Introduction

Capital projects have never been more complex, or more expensive, to get wrong. From aerospace and defense to manufacturing, energy, and oil and gas, organizations are managing more active projects, larger portfolios, and higher stakes than ever, all while trying to make faster, better-informed decisions.

This report captures how professionals overseeing capital projects and high-risk investments are using AI today, where they see it adding value, and where trust hasn’t caught up to adoption: just 10% would act on an AI recommendation without significant review.

The picture that emerges isn’t one of AI falling short. It’s one of AI adoption scaling faster than organizations’ ability to unify the siloed project and risk data it depends on.

96%

of organizations expect to increase their AI spending over the next two years.

81%

cite fragmented data as their top challenge.

10%

would act on an AI recommendation without significant review.

While investment in AI is nearly universal, with 96% of organizations expecting to increase their AI spending over the next two years, the data behind those decisions remains fragmented: 81% cite it as their top challenge, scattered across disconnected systems, pieced together by hand, and often too slow to reach the people who need to act on it.

Ask respondents what they want AI to do first, and the clearest answer is to show them what they already have across their portfolio, in one place, before commitments lock in. Realizing AI’s promise for prediction and automation starts with that more foundational step.

This report explores what the data shows about where organizations stand today, what they want AI to do next, and what stands between them and confident, real-time decision-making across their capital project portfolios.

Forewords by Jareth Reeves and Kareem Khattab

Jareth Reeves

Jareth Reeves

CEO and Founder, Kaleido
President, AACE International – United Kingdom Section

Adoption alone won’t close the gap

This research makes a valuable contribution to understanding how capital project professionals are approaching AI. It highlights a defining challenge to turn technological capability into decisions that people can trust, explain, and act upon.

The clearest signal is fragmentation, and its consequence shows up downstream: many describe decision-making as structured but delayed, with information arriving too late to shape the decisions it’s meant to inform.

Read the full forewordShow less

My takeaway is that organizations risk producing information faster without strengthening the connections that make it useful and trustworthy. The findings show broadly similar patterns of information arriving too late across AI adoption groups, suggesting that adoption alone may not resolve the gap between insight and action. We risk deploying technology at the presentation layer while leaving integration problems unresolved.

For me, this reinforces the importance of Decision Intelligence for connecting the behavioral science of people and culture, structured management of processes, and technology around the decisions an organization needs to make. In capital projects, that means bringing a coherent picture, particularly during early planning, when assumptions shape commitments, and continuing development of that narrative through lifecycles in execution, rather than status reports. Evidence must be fit for the decision when using AI, with uncertainty visible and accountability clear.

From the sample, the appetite for explainability is encouraging. 85% considered it very or critically important with practitioners recognizing that recommendations must withstand scrutiny and assurance. People accountable for consequential commitments need to understand and challenge the evidence behind recommendations. AI should support professional judgement, preserving evidence, assumptions and decision rationale so choices can be scrutinized, revisited, and improved.

Looking three to five years ahead, cross-portfolio intelligence and predictive analytics lead expectations, ahead of agentic AI and natural language interfaces. I read this as an appetite for better understanding and foresight. It offers a useful direction for developing our ability to question assumptions, compare alternatives and understand dependencies alongside our investment in technology. The opportunity is to strengthen decision quality, build lasting capability within project teams and help leaders make timely commitments that their evidence can support and defend.


Connect with Jareth

Kareem Khattab

Kareem Khattab, PE, PSP, PMP, MCIArb

President, AACE International – Australian Section

AI should accelerate analysis, not replace human insight

AI adoption is outpacing readiness. Lumivero’s survey found that 96% expect increased AI investment, yet 88% report limited preparedness and 81% fragmented data. The risk is an “authority illusion”: polished output may be trusted before its data, assumptions, and consequences are challenged. The challenge is therefore not adoption alone, but establishing the controls and capability needed to rely on AI responsibly.

Read the full forewordShow less

I see AI primarily as an analytical accelerator. It can summarize documents, compare contracts, analyze data, identify patterns, produce charts, test scenarios, and forecast when reliable data and comparable conditions exist. Its value is giving humans faster analysis from which to develop solutions.

AI can generate options from patterns in existing information. Humans must still determine what matters and create new solutions when precedent is weak, circumstances change, or human factors dominate.

Past data is most useful when the future resembles the past; it may mislead where outcomes depend on behavior, trust, leadership, negotiation, culture, or changing relationships. In supplier selection, for example, AI may rank a supplier highest on price and past performance while missing current capacity constraints or how cooperation may affect delivery. Historical metrics inform analysis but cannot fully predict capability, behavior, or performance under pressure.

AI should be adopted step by step, with autonomy increasing only as reliability is demonstrated and task risk permits. An organizational policy should define approved uses, restricted inputs, data-quality requirements, review thresholds, escalation, and record-keeping. AI outputs should disclose its sources, assumptions, confidence, limitations, and missing information rather than present every answer as complete.

A practical model is “two gates and one owner.” The input gate confirms that data is authorized, secure, current, sufficiently complete, and relevant to the required decision. The output gate challenges sources, assumptions, calculations, gaps, and consequences. A named human owner decides how to act on the analysis and remains accountable. This model is consistent with NIST’s AI Risk Management Framework and ISO/IEC 42001.

AI’s greatest contribution is enabling better-informed human judgment sooner. That’s the lens worth bringing to the findings ahead.

Connect with Kareem

Key insights

Executive summary

“The State of AI in Capital Project Decision-Making” report captures the voices of senior managers, directors, executives, and technical specialists to uncover how organizations are adopting, trusting, and governing AI in their capital project and portfolio decisions. The industries represented include construction and real estate, government and infrastructure, manufacturing, energy and utilities, aerospace and defense, and bioscience and pharma, spanning organizations from under 500 employees to more than 5,000.

The findings paint a clear picture: 61% of organizations are already using or piloting AI in project and portfolio decisions, but the data infrastructure underneath those decisions hasn’t caught up. The data feeding them remains fragmented, manually reported, and often too slow to act on.

61%

AI adoption is already widespread.

61% of organizations are actively using AI in multiple areas (29%) or piloting it (32%); only 5% have no active plans to adopt it in the near term.

81%

Fragmented data is capital project management’s defining barrier.

81% cite fragmented, inconsistently formatted data as their top challenge, close to double the next most common concern, project schedules and timelines are misaligned across programs (46%). Fewer than one in five organizations describe their data management as well-integrated (15%) or highly mature (3%).

42%

Decisions lag behind the data.

42% take more than a week to move from identifying a risk to making an informed decision about it; 62% describe their overall approach to capital project decisions as “structured, but delayed.”

10%

Trust in AI is conditional, not automatic.

Just 10% would act on AI recommendations without significant review; 85% say it’s very or critically important that AI can explain how it reached a recommendation, not just deliver one.

61%

AI adoption scales with size and stakes.

Organizations with more than 5,000 employees are overrepresented among active AI users (61% vs. 43% overall); active users account for the large majority of the survey’s largest portfolios, those exceeding $5B in value.

96%

Investment is nearly universal, but ROI isn’t proven yet.

96% expect their AI investment to increase over the next two years, yet only 17% report a strong, clearly measurable ROI from AI to date.

Every finding in this report points in the same direction: organizations aren’t short on ambition for AI, they’re short on the connected data foundation it needs to deliver on that ambition.

Where AI stands today

AI adoption in capital project decision-making is well underway. 61% of organizations are either actively using AI in multiple areas (29%) or piloting it (32%); only 5% have no active plans to adopt it.

Among the respondents already using AI, the most common applications are reporting and executive dashboards (60%) and document management and contract analysis (58%); procurement and supply chain remain the least-explored use case (19%).

It’s also arriving at an already crowded toolkit. AI is landing on top of the project management, portfolio, and risk systems organizations already run: 79% use project management tools, 53% use dedicated strategic or project portfolio management software, 42% use quantitative risk analysis or enterprise risk management (ERM) tools, and 41% already count AI/LLM providers as a distinct software category in their own right.

Key insights

  • 61% of organizations are actively using or piloting AI in project/portfolio decision-making.
  • Reporting/dashboards (60%) and document/contract analysis (58%) lead current AI use cases, ahead of every other application tested.
  • Procurement and supply chain remain the least-explored AI use case, at just 19%.
  • 41% of organizations count AI/LLM providers as a distinct software category, alongside project management, portfolio, and risk tools.
  • 29% of organizations use no dedicated tool for strategic or portfolio management.

Where AI is currently being used or piloted

Organizations using or piloting AI, selecting all that apply. Showing: Active or piloting combined

Schedule risk analysis and forecasting
46%
Cost control and earned value management
38%
Resource planning and allocation
46%
Risk identification and prioritization
54%
Reporting and executive dashboards
60%
Portfolio-level scenario planning
40%
Document management and contract analysis
58%
Procurement and supply chain
19%
Other
8%

Adoption concentrates at scale

Across four different measures of scale, company size, portfolio dollar value, number of active capital projects, and project duration, the pattern holds consistently: AI adoption concentrates at the top.

Company size is the clearest signal: organizations with more than 5,000 employees are overrepresented among active AI users in multiple areas (61% vs. 43% overall). The same holds at the portfolio level: active AI users across multiple areas account for the large majority of the very largest portfolios, those exceeding $5B in total value (26% vs. 0-8% among other AI-adoption groups).

Project-level scale tells the same story: active AI users manage a higher share of very large capital projects, with 30% managing 200 or more active projects at once, versus 24% overall.

Key insights

  • Organizations with 5,000+ employees are overrepresented among active AI users (61% vs. 43% overall).
  • Active AI users account for the large majority of $5B+ portfolios (26% vs. 0-8% among other adoption groups).
  • Active AI users manage a higher share of very large capital projects, with 30% managing 200 or more at once, compared to 24% across the full sample.
  • Organizations with no plans to adopt AI focus almost exclusively on short-term projects lasting 1 to 3 years (75%) and are absent entirely from the top project value tier, managing none over $500M.

AI adoption by organization size and total portfolio value

Switch between organization size and total portfolio value. Each bar is one stage of AI adoption.

1,001–5,000501–1,000Less than 500Over 5,000
No, and we have no active plans to adopt AI in the near term
25%
25%
50%
No, but we are evaluating AI solutions
30%
11%
22%
37%
Yes, we are actively using AI in multiple areas
13%
22%
61%
Yes, we have one or more pilot projects underway
36%
16%
16%
32%

What respondents want AI to do

43% say AI’s single biggest value is flagging risks, anomalies, and trends across the portfolio, ahead of every other capability tested. Another 28% want AI to synthesize data from multiple systems into a single, prioritized view.

Once insights are surfaced, opinion splits more evenly on what to do with them. Asked where AI would add the most value in acting on project insights and making decisions, respondents were nearly split across four options, with “maintain a real-time view of portfolio health” and “recommend a specific set of actions ranked by impact or urgency” tied for the lead at 28% each.

Open-ended responses tell the same story in their own words. Asked what one thing AI could do to help their team make better decisions, respondents most often described wanting a single, real-time view of fragmented project and portfolio data, backed by better data quality and validation. Predictive analysis and scenario planning also came up often: forecasting delays and budget overruns, comparing options, and prioritizing investments with clear rationale.

Key insights

  • 43% want AI to automatically flag risks, anomalies, or trends across the portfolio, the single most-requested capability tested.
  • 28% want AI to synthesize data from multiple systems into one prioritized view, rising to 39% among organizations already using AI across multiple areas.
  • Just 1% want AI to help identify what competitors or peers are doing, the least-requested capability by a wide margin.

Note: open-ended themes reflect a smaller, coded sample and should be read as indicative rather than generalizable.

On the difficulty of integrating data across systems

“Our agency has so much data that it continues to be virtually impossible to input data from different systems and complete a full analysis. Data gaps are a significant problem for us and prohibits proactive approaches to identified risks.”
— Director / Head of Department, Government & Infrastructure

Where AI would add the most value in processing project data

One answer per respondent. Compare by AI adoption stage. Showing: All respondents

Automatically flag risks, anomalies, or trends — including patterns across programs that no single project would surface on its own
43%
Fill in gaps in our data by drawing on industry benchmarks or adjacent sources
6%
Help identify what competitors or peers are doing in similar situations
1%
Identify optimization opportunities across project schedules and dependencies that would be impossible to spot manually
18%
Synthesize data from multiple systems into a single, prioritized view
28%
Other
4%

Where AI would add the most value in actioning on insights

One answer per respondent. Compare by AI adoption stage. Showing: All respondents

Maintain a real-time view of portfolio health — surfacing the full context of risks, dependencies, trade-offs, and status
28%
Provide plain-language summaries executives can act on quickly
19%
Recommend a specific set of actions ranked by impact or urgency
28%
Run ’what if’ scenario models to test different courses of action
25%

How AI use matures with adoption

Pilot-stage organizations lean hardest into risk-flagging: 60% want AI to automatically surface risks, well above the 43% average across all respondents. Once organizations move into active, multi-area AI use, that emphasis shifts toward synthesis, combining data from multiple systems into one view (39%)—a more advanced ask that becomes more common only after the pilot stage.

That same maturity curve shows up in what respondents want AI to do with insights once they’re surfaced. Among organizations that answered ‘yes’ to using AI, whether piloting or already active across multiple areas, that even split seen across all respondents gives way to a clear preference for recommendations (74%) and scenario modeling (64%).

Key insights

  • Pilot-stage organizations lean toward risk-flagging first (60% vs. 43% overall), suggesting a maturity curve in how AI use expands over time.
  • Organizations already using AI across multiple areas shift toward data synthesis (39%), a more advanced request that grows after the pilot stage.
  • Appetite for AI-generated action recommendations and scenario modeling rises with AI use.

What respondents want AI to do, by adoption stage

Where AI would add the most value in processing project data. Each bar is one stage of AI adoption.

Automatically flag risks, anomalies, or trends — including patterns across programs that no single project would surface on its ownFill in gaps in our data by drawing on industry benchmarks or adjacent sourcesHelp identify what competitors or peers are doing in similar situationsIdentify optimization opportunities across project schedules and dependencies that would be impossible to spot manuallyOtherSynthesize data from multiple systems into a single, prioritized view
No, and we have no active plans to adopt AI in the near term
50%
50%
No, but we are evaluating AI solutions
33%
30%
26%
Yes, we are actively using AI in multiple areas
35%
9%
9%
39%
Yes, we have one or more pilot projects underway
60%
16%
16%

Big ambition, fractured foundations

Before organizations can put AI to work on capital project decisions, they need reliable, connected data to feed it. Right now, most don’t have it. Only 15% describe their data management as well-integrated, and just 3% call it highly mature. The most common state, at 38%, is “partially integrated”—some dedicated software exists, but data still lives in silos.

The silos are specific: schedule and cost data typically lives in project management tools (used by 79% of organizations), risk data lives separately in dedicated quantitative risk analysis or enterprise risk management software (42%), and portfolio-level data lives in yet another category of strategic or portfolio management tools entirely (53%).

This fragmentation is respondents’ single biggest data-related challenge by a wide margin: 81% cite it as a top issue, more than double the next most common concern, misaligned project schedules and timelines across programs (46%).

Hands marking up construction drawings with a pen

Key insights

  • 81% say fragmented, inconsistently formatted data is a top challenge, far ahead of any other issue.
  • Only 18% of organizations describe their data management as well-integrated (15%) or highly mature (3%).

How organizations manage data for capital projects and high-risk investments

All respondents, from most to least mature.

Highly mature — data is centralized, real-time, and consistently acted upon
3%
Well-integrated — data managed highly consistently with organization needs
15%
Integrated — most data flows into connected systems
25%
Partially integrated — some dedicated software, but data still lives in silos
38%
Mostly manual — data is managed through spreadsheets and documents
19%

The biggest data-related challenges in capital project decisions

Selecting all that apply, so shares add to more than 100%. Showing: All respondents

Data is fragmented — scattered across systems and reported in inconsistent formats across teams
81%
Data is outdated by the time it reaches decision-makers
32%
There are significant gaps in the data we have access to
41%
Senior leaders are unable to extrapolate the pertinent insights from project-level data
35%
We are overwhelmed by data — analysis paralysis
28%
Project schedules and timelines are misaligned across programs, making it difficult to identify dependencies and prioritize decisions
46%
Risks and issues that emerge from patterns across multiple projects are invisible at the portfolio level — no single project would surface them on its own
34%
Other
5%

The cost of fragmented data

Fragmented data costs organizations time they don’t have. For 42% of organizations, the gap between identifying a risk and making an informed decision about it exceeds one week; 9% say they have no consistent process for this at all.

Much of that gap comes down to how the data travels: 65% of senior leaders still rely on manual slide decks for portfolio updates, and only 58% have access to live dashboards in project management software—figures that can overlap, since respondents could select every format that applied.

The consequences show up further downstream. 57% say critical information—cost overruns, schedule slippage, emerging risks—occasionally fails to reach decision-makers in time to act, and 22% call this a frequent, ongoing problem.

It’s little surprise, then, that 62% describe their organization’s overall approach to capital project decisions as “structured but delayed”: processes exist, but decisions lag behind the data.

Key insights

  • 42% take more than a week to move from identifying a risk to deciding on it; 9% have no consistent process at all.
  • 65% of senior leaders still rely on manual slide decks or reports for portfolio updates, ahead of the 58% with dashboard access.
  • 22% say critical information frequently fails to reach decision-makers in time to act; only 1% say it never happens.

How often critical information fails to reach decision makers in time

Compare by AI adoption stage. Showing: All respondents

Frequently — this is an ongoing problem
22%
Occasionally — it happens but is not the norm
57%
Rarely
18%
Never — our reporting is reliable and timely
1%
Unsure
3%

Organization’s current approach to capital project decision-making

Compare by AI adoption stage. Showing: All respondents

Optimized — AI and human judgment are deeply integrated; decisions are continuous and real-time
3%
Predictive — we use advanced analytics or AI to model outcomes and act ahead of risk
3%
Proactive — we use data and reporting to anticipate issues before they escalate
15%
Structured but delayed — we have processes in place but decisions lag behind the data
62%
Reactive — we respond to problems as they arise, often after impact is already felt
18%

Trust, governance, and the human-in-the-loop

With decisions already lagging behind the data, the next question is whether AI can close that gap. Respondents are clear on the answer: AI can flag the risk. They don’t want it to sign off on the decision.

Just 10% of respondents would act on an AI recommendation without significant review; 51% treat AI output as a starting point requiring significant human judgment, and 37% use it as a strong input they still verify key assumptions.

Explainability isn’t optional, either: 85% say it’s very (46%) or critically (39%) important that AI can explain how it reached a recommendation, not just deliver one.

Regulatory pressure reinforces the same caution, with 83% saying regulation shapes their approach to AI adoption to at least a moderate degree.

Respondents are just as clear that AI can’t work in a vacuum from the systems already in place: 89% say it’s very important (54%) or critical (35%) that AI integrates and shares data with their existing project management tools, rather than operating as its own separate silo.

Key insights

  • Just 10% would act on an AI recommendation without significant review, while 88% treat it as an input requiring human judgment or verification.
  • 85% say AI explainability is very or critically important—a near-universal requirement, not a preference.
  • 89% say seamless integration between AI and existing project management tools is very important or critical.
  • 83% say regulation shapes their AI strategy to at least a moderate degree, reinforcing the same caution seen in trust and explainability.

On AI’s role in decision-making

“[AI] should support—not replace—human judgment, with clear explanations for recommendations and attention to customer impact and equity.”
— Specialist / Technical Expert, Energy & Utilities

Trust in AI-generated recommendations for capital project decisions

Compare by AI adoption stage. Showing: All respondents

Completely — I would act on AI recommendations without significant review
10%
Mostly — I’d use AI recommendations as a strong input but verify key assumptions
37%
Somewhat — I’d treat AI recommendations as a starting point requiring significant human judgment
51%
Minimally — I’m skeptical of AI recommendations until proven over time
1%
Not at all — I don’t believe AI is reliable enough for this context yet
1%

Importance of AI explainability in decision-making

Compare by AI adoption stage. Showing: All respondents

Critically important — we would not adopt AI without this
39%
Very important
46%
Somewhat important
11%
Not particularly important — results matter more than explanations
3%
Unsure
1%

Investment, ROI, and the readiness gap

Caution hasn’t slowed the spending. 96% of organizations expect their AI investment to increase over the next two years, with 40% expecting a significant increase, a figure that climbs to 59% among organizations already using AI across multiple areas. What’s driving that investment splits three ways: AI as a strategic differentiator (29%), a competitive necessity (28%), and an operational improvement (28%). Only 5% frame it primarily as a risk mitigation tool.

Return on investment, however, remains hard to pin down. 58% describe their ROI from AI to date as “positive but unclear,” and just 17% report a strong, clearly measurable ROI. Competitive pressure adds urgency: 68% feel moderate pressure to keep pace with peers on data and AI use.

Confidence hasn’t caught up with intent, either. 88% describe their organization as only minimally (35%) or somewhat (53%) prepared to leverage AI for capital project decisions; just 12% feel very prepared. The most common barriers are concerns about data privacy and security (56%) and data quality issues (53%), closely followed by a lack of internal AI expertise (49%).

Key insights

  • 96% expect AI investment to increase over the next two years, with 40% expecting a significant increase.
  • Views on AI investment split three ways—strategic differentiator (29%), competitive necessity (28%), and operational improvement (28%).
  • Only 17% report a strong, clearly measurable ROI from AI to date; 58% call their ROI positive but unclear.
  • 88% feel only minimally or somewhat prepared to leverage AI for capital project decisions.
  • Data privacy/security (56%) and data quality (53%) rank as the top barriers, closely followed by a lack of internal AI expertise (49%).

Expected change in AI investment over the next two years

Compare by AI adoption stage. Showing: All respondents

Increase significantly
40%
Increase somewhat
56%
Stay the same
3%
Unsure
1%

Perceived ROI from AI to date

Asked only of organizations using or piloting AI. Showing: Active or piloting combined

Break-even — the value and cost are roughly balanced
6%
Positive but unclear — we believe AI is adding value, but it’s difficult to measure precisely
58%
Strong ROI — the value AI delivers clearly outweighs the cost
17%
Too early to assess
15%
We don’t currently measure AI ROI
4%

Industry spotlight

Five sectors, each with its story from the report and where it sits against every other industry surveyed. The sector bar stays with you as you scroll, so you can jump between them at any point.

Note: Industry-level figures reflect a subgroup of the full sample and should be read as indicative rather than generalizable.

Industry spotlight: Construction & real estate

Construction and real estate organizations manage the densest project loads of any industry: 40% run 100-199 active projects at a time, and 15% run 200 or more, well above other sectors. This sector is also the most affected by information reaching decision makers too late: 40% say critical information frequently fails to reach decision makers in time to act, against an average of 22%.

Despite that gap, construction and real estate organizations show the highest trust in AI of any sector: 30% would act on AI recommendations without significant review, compared to an average of 10%.

Construction and real estate, alongside energy and utilities, is also among the most action-oriented sectors surveyed: 50% of respondents across these two sectors prioritize AI-generated recommendations ranked by impact or urgency, compared to an average of 28%. This sector is also the sector most likely to frame AI investment as a competitive necessity (40% vs. 28% overall).

Key insights

  • 40% of construction and real estate organizations run 100-199 active projects at once, and 15% run 200 or more, the densest project loads of any sector.
  • 40% say critical information frequently fails to reach decision makers in time to act, the highest rate of any industry surveyed.
  • 30% would act on an AI recommendation without significant review, three times the survey average and the highest trust level in the sample.
  • 40% frame AI investment as a competitive necessity, compared to 28% overall.

Note: Industry-level figures reflect a subgroup of the full sample and should be read as indicative rather than generalizable.

On real-time predictive insight across the portfolio

“If AI could do one thing to help my team make better decisions, it would be to analyze project and portfolio data in real time and provide predictive insights on risks, costs, schedules, and resource constraints.”
— Senior Manager / Program Lead, Construction & Real Estate

Active capital projects managed, by industry

Construction & real estate is outlined.

100-19910–49200 or more50–99Fewer than 10
Aerospace & defense
33%
22%
11%
33%
Bioscience & pharma
10%
40%
30%
10%
10%
Construction & real estate
40%
35%
15%
Energy & utilities
38%
38%
25%
Government & infrastructure
11%
33%
28%
17%
11%
Manufacturing
29%
29%
14%
29%
Other industries
29%
29%
29%
14%

Critical information failing to reach decision makers, by industry

Construction & real estate is outlined.

Frequently — this is an ongoing problemOccasionally — it happens but is not the normNever — our reporting is reliable and timelyRarelyUnsure
Aerospace & defense
22%
33%
11%
33%
Bioscience & pharma
10%
60%
30%
Construction & real estate
40%
50%
Energy & utilities
88%
13%
Government & infrastructure
17%
61%
22%
Manufacturing
29%
57%
14%
Other industries
14%
57%
29%

Industry spotlight: Government & infrastructure

Government and infrastructure organizations carry the heaviest regulatory weight of any sector surveyed: 50% say regulation significantly affects their approach to AI, against an average of 32%.

That caution runs deep. This sector reports the lowest AI preparedness in the survey: 56% describe themselves as only minimally prepared, versus 35% overall, and it’s the only sector reporting “not prepared” responses at all.

It’s also the sector most likely to describe its decision-making as reactive rather than proactive or predictive: 33%, compared to 18% overall. Adoption itself reflects that caution: alongside aerospace and defense, government and infrastructure have the highest proportion of organizations still evaluating AI solutions (56%).

Key insights

  • 50% say regulation significantly shapes their AI strategy, well above the 32% average across all sectors.
  • 56% describe their organization as only minimally prepared to leverage AI, the lowest preparedness of any sector.
  • 33% describe their decision-making approach as reactive, the highest of any sector.
  • 56% are still evaluating AI solutions rather than actively using them in their project portfolio management processes, tied with aerospace and defense for the highest share of any sector.

Note: Industry-level figures reflect a subgroup of the full sample and should be read as indicative rather than generalizable.

On the speed AI could bring to a resource-constrained sector

“AI will enable us to quickly and broadly gather scope and requirements in a pace that’s significantly faster than what we are capable of currently. It will also enable us to condense data and extract key metrics that previously would have taken analysts a significant workload burden and man-hours.”
— Senior Manager / Program Lead, Government & Infrastructure

Regulatory influence on AI strategy, by industry

Government & infrastructure is outlined.

Minimally — regulation has not been a significant barrierModerately — we need to be careful, but it doesn’t prevent adoptionNot applicable to our contextSignificantly — regulatory constraints are a primary factor shaping our AI strategy
Aerospace & defense
11%
33%
11%
44%
Bioscience & pharma
20%
40%
40%
Construction & real estate
15%
65%
20%
Energy & utilities
25%
75%
Government & infrastructure
44%
50%
Manufacturing
14%
71%
14%
Other industries
29%
14%
14%
43%

AI adoption status, by industry

Government & infrastructure is outlined.

No, and we have no active plans to adopt AI in the near termNo, but we are evaluating AI solutionsYes, we are actively using AI in multiple areasYes, we have one or more pilot projects underway
Aerospace & defense
11%
56%
33%
Bioscience & pharma
10%
40%
50%
Construction & real estate
25%
40%
30%
Energy & utilities
50%
50%
Government & infrastructure
11%
56%
17%
17%
Manufacturing
43%
14%
43%
Other industries
43%
43%
14%

Industry spotlight: Energy & utilities

Energy and utilities organizations carry the highest financial stakes in the sample: 38% report average project budgets exceeding $1B, and 38% report total portfolio value exceeding $5B, both far above any other sector. This sector also shows an unusual bimodal project count, with 38% managing 10-49 active projects and 38% managing 200 or more, suggesting two very different organizational profiles coexist within it.

This sector is also the most AI-mature surveyed: 50% are actively using AI across multiple areas, the highest of any sector, and it’s the only sector with meaningful adoption of a “predictive” decision-making approach (25% vs. 3% overall).

Notably, this sector wants something different from AI than most others: 63% want AI to synthesize data from multiple systems into one view, while none selected automatically flagging risks, a near-total reversal of the overall pattern.

Key insights

  • 38% report total portfolio values exceeding $5B, the highest financial stakes of any sector.
  • 50% are actively using AI across multiple areas, the highest adoption level in the sample.
  • 63% prioritize AI synthesizing data from multiple systems, well above any other sector.
  • This sector shows an unusual bimodal profile: 38% manage just 10-49 active projects, while another 38% manage 200 or more, with almost nothing in between.

Note: Industry-level figures reflect a subgroup of the full sample and should be read as indicative rather than generalizable.

On combining scattered signals into earlier warning

“AI could make capital-project decisions more proactive by combining project status, costs, contractor capacity, customer needs, asset condition, and prior outcomes to identify risks and prioritize investments earlier.”
— Specialist / Technical Expert, Energy & Utilities

Where AI adds the most value in processing data, by industry

Energy & utilities is outlined.

Automatically flag risks, anomalies, or trends — including patterns across programs that no single project would surface on its ownFill in gaps in our data by drawing on industry benchmarks or adjacent sourcesHelp identify what competitors or peers are doing in similar situationsIdentify optimization opportunities across project schedules and dependencies that would be impossible to spot manuallyOtherSynthesize data from multiple systems into a single, prioritized view
Aerospace & defense
33%
44%
22%
Bioscience & pharma
60%
10%
10%
20%
Construction & real estate
60%
15%
20%
Energy & utilities
38%
63%
Government & infrastructure
39%
17%
39%
Manufacturing
86%
14%
Other industries
43%
14%
43%

Industry spotlight: Aerospace & defense

Aerospace and defense organizations stand apart in how they want to use AI. 67% prioritize maintaining a real-time view of portfolio health, by far the highest of any sector, and shows no interest in AI-generated action recommendations, the opposite emphasis from construction and real estate and energy and utilities.

This sector also reports the most reliable critical project information flow of any sector: it’s the only one with a meaningful share of “never” responses (11%) to critical information failing to reach decision makers, and the highest share of “rarely” (33%).

Seamless integration between AI and project management tools is particularly important in this sector—56% of aerospace and defense organizations say it’s critical, not just important, the highest requirement in the sample. This integration-first priority is reflected in their adoption timeline: alongside government and infrastructure, this sector has the highest proportion of organizations still evaluating AI solutions for their project portfolio management process rather than actively using them (56%).

Key insights

  • 67% want AI to maintain a real-time view of portfolio health, the strongest preference in the sample.
  • Only 11% say critical information never fails to reach decision makers, and 33% say it rarely does, the most reliable information flow of any sector.
  • 56% say AI integration with existing tools is critical, the highest requirement of any sector.
  • 56% are still evaluating AI solutions rather than actively using them, tied with government and infrastructure for the highest share of any sector.

Note: Industry-level figures reflect a subgroup of the full sample and should be read as indicative rather than generalizable.

On forecasting costs and staying competitive on contracts

“One of the most challenging areas we have is bidding on contracts, trying to stay competitive and profitable. Insights for this process including what the industry standard is looking like as the landscape changes would be helpful.”
— Senior Manager / Program Lead, Aerospace & Defense

Where AI adds the most value in acting on insights, by industry

Aerospace & defense is outlined.

Maintain a real-time view of portfolio health — surfacing the full context of risks, dependencies, trade-offs, and statusProvide plain-language summaries executives can act on quicklyRecommend a specific set of actions ranked by impact or urgencyRun ’what if’ scenario models to test different courses of action
Aerospace & defense
67%
22%
11%
Bioscience & pharma
40%
10%
50%
Construction & real estate
25%
15%
50%
10%
Energy & utilities
25%
13%
50%
13%
Government & infrastructure
17%
39%
22%
22%
Manufacturing
14%
29%
57%
Other industries
14%
29%
14%
43%

Industry spotlight: Manufacturing

Manufacturing has already proven AI’s value, but decision making hasn’t sped up because of it. It’s the only sector where a majority reports measurable AI ROI as “Too early to assess,” and it also has the slowest decision-making cycle in the sample: 43% take more than two weeks to move from identifying a risk to deciding on it, the highest of any sector. This sector is also the most focused on automated risk detection specifically: 86% want AI to automatically flag risks, anomalies, or trends, far above the 43% overall average.

Open-ended responses point toward an organizational culture barrier. Manufacturing, alongside aerospace and defense, shows the strongest representation in open-ended themes around adoption, governance, and trust challenges.

Key insights

  • 43% take more than two weeks to move from risk identification to decision, the slowest cycle in the sample.
  • 86% want AI to automatically flag risks and anomalies, the strongest preference of any sector.
  • Manufacturing is the only sector where a majority reports measurable AI ROI as “Too early to assess.”

Note: Industry-level figures reflect a subgroup of the full sample and should be read as indicative rather than generalizable.

On adoption, governance, and trust challenges

“Corporate culture is very conservative so it will take time to adapt AI for the decision making tool.”
— Survey respondent, Manufacturing

Perceived ROI from AI to date, by industry

Organizations using or piloting AI only. Manufacturing is outlined.

Break-even — the value and cost are roughly balancedPositive but unclear — we believe AI is adding value, but it’s difficult to measure preciselyStrong ROI — the value AI delivers clearly outweighs the costToo early to assessWe don’t currently measure AI ROI
Aerospace & defense
67%
33%
Bioscience & pharma
78%
11%
11%
Construction & real estate
14%
43%
21%
21%
Energy & utilities
75%
25%
Government & infrastructure
83%
17%
Manufacturing
25%
75%
Other industries
50%
25%
25%

Take the full report with you

Every finding, chart, and industry spotlight in one PDF to share with your team.

Download the report

Looking ahead: Where AI goes, and who stays in charge

Every sector tells its own version of this story, but ask any of them where AI goes next, and the answer converges. Cross-portfolio intelligence (63%) and predictive analytics (62%) are expected to have the greatest impact on organizational decision-making over the next 3-5 years, far outpacing agentic AI (32%) and natural language interfaces (10%), which respondents ranked as the least impactful capability of those tested.

Respondents expect that shift to happen in stages, and to add up to something concrete: early adoption concentrating on data synthesis, anomaly detection, and plain-language summaries, evolving toward more advanced predictive intelligence as data quality and system integration improve. From there, they expect AI to integrate fragmented cost, schedule, risk, and scope data from multiple systems into comprehensive, real-time portfolio views, enabling earlier risk detection, predictive analytics, scenario planning, and automated reporting—helping leaders prioritize investments, manage complex dependencies, and optimize funding allocation with greater transparency and governance.

Faster and more automated doesn’t mean unsupervised, though. Respondents generally expect to retain human judgment even as AI takes on more of the work: cultural and governance challenges remain, with explainability, auditability, data security, and human oversight repeatedly emphasized as priorities, particularly for high-risk or public-sector projects.

Taken together, respondents expect AI to accelerate decision cycles, reduce manual data tasks, improve forecasting, and support more proactive risk management, ultimately enabling faster, more confident capital investment decisions across industries including defense and infrastructure.

Streams of colored light converging on a circuit board

Key insights

  • Cross-portfolio intelligence (63%) and predictive analytics (62%) are expected to have the greatest impact on organizational decision-making over the next 3-5 years.
  • Respondents rank natural language interfaces lowest (10%) among the AI capabilities they expect to have the greatest impact.
  • Respondents consistently frame AI as a support to human judgment, particularly for high-risk or public-sector decisions, not a replacement for it.

On what the future of AI could look like

“Over the next five years, I expect AI to make capital project decision-making more proactive and data-driven by improving forecasting, identifying risks earlier, and helping leaders evaluate tradeoffs across cost, schedule, resources, and strategic priorities.”
— Senior Manager / Program Lead, Bioscience & Pharma

Expected high-impact AI capabilities over the next 3-5 years

Selecting all that apply. Compare by AI adoption stage. Showing: All respondents

Predictive analytics — forecasting project outcomes before problems emerge
62%
Agentic AI — systems that can autonomously take defined actions on your behalf
32%
Natural language interfaces — asking questions and getting answers in plain language
10%
Cross-portfolio intelligence — identifying patterns and risks across all projects simultaneously
63%
Competitive and market scanning — using external data to inform project strategy
15%
Automated reporting and executive summaries
15%
Other
0%

One connected view, and AI that’s grounded in it

Every finding points to the same gap: organizations have the ambition and the data. What they lack is one way to see it all. 81% call their data fragmented. 88% feel only minimally or somewhat prepared to act on AI’s promise. 42% wait more than a week between spotting a risk and deciding what to do about it.

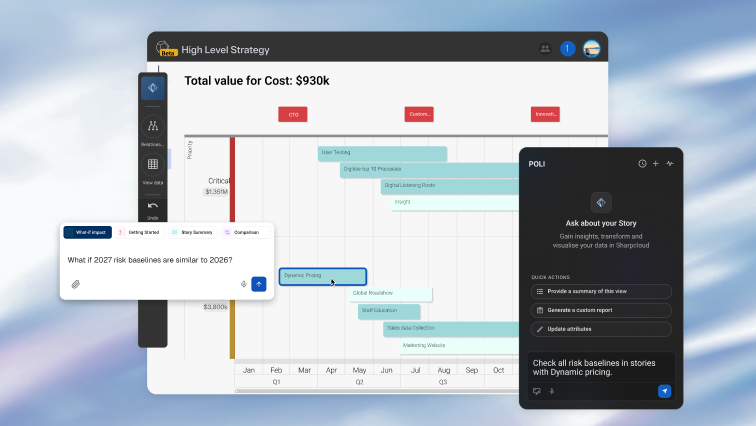
SharpCloud already closes the first part of that gap: it connects strategy, portfolio, and risk data into a single, interactive environment that sits above the tools organizations already run, no rip-and-replace required. What this report’s respondents are describing, though, isn’t just a connected view. It’s a connected view they can question, and one that can act on their behalf, with a person still signing off on every change.

That’s the role of SharpCloud’s agentic platform, powered by POLI. Built natively inside SharpCloud’s connected model, it works with an organization’s own portfolio, project, and risk data, not a generic chat window disconnected from the work behind it. Ask which projects are at risk, and POLI computes the answer across the live portfolio and shows you how it got there. Every recommendation stays a recommendation: a person reviews and decides. POLI can surface what to do next, but it respects your permissions, and it doesn’t act on your behalf, keeping it grounded in human control and organizational governance.

That design is a direct answer to what this survey’s respondents asked for. 85% said explainability is very or critically important. 89% said AI has to integrate with the systems they already use, not operate as its own silo. Only 10% said they’d act on an AI recommendation without review.

Seeing the whole picture shouldn’t be the hard part, and soon, neither should trusting the AI that helps you act on it. SharpCloud is ready to help your team move from disconnected reports to one connected view today, with AI built for exactly this kind of trust.

SharpCloud

See your portfolio in one connected view

Connect strategy, portfolio, and risk data above the tools you already run—with AI that shows its reasoning and leaves every decision to a person.

Appendix: Survey methodology

This report is based on a survey of professionals involved in capital project and high-risk investment decision-making, examining current AI adoption, tool use, trust, and governance practices in project and portfolio decisions. The survey combined closed-ended questions, analyzed quantitatively, with two open-ended questions on how AI could improve decision-making today and how it’s expected to change decision-making over the next five years, coded thematically. The survey was fielded from June 17, 2026 to Aug. 21, 2026.

Sample composition

Construction & Real Estate and Government & Infrastructure made up the two largest industry groups, followed by Aerospace & Defense, Bioscience & Pharma, Energy & Utilities, Manufacturing, and Other. The sample skewed toward management and leadership roles: Senior Manager/Program Lead (44%) and Director/Head of Department (30%) made up the largest groups, with Executive/C-suite (14%) and Specialist/Technical Expert (6%) less represented. Geographically, the sample leaned heavily toward North America: 71% of respondents were based in the United States. Organizations represented were predominantly large: 43% reported more than 5,000 employees, and 25% reported between 1,001 and 5,000.

How the charts on this page were made

Every chart is calculated from the survey responses and rounded to whole numbers. Where the report quotes a combined figure, such as 88% treating AI as an input requiring human judgment or verification, it adds the rounded parts (51% + 37%). Questions on AI use cases and ROI were asked only of the organizations using or piloting AI. Industry and adoption-stage groups are small, so treat differences between them as indicative.

Analysis team and tool citations

Analysis team:

  • Fiona Wiltshier, MA, MSc, NVivo Training and Certification Manager, Lumivero—qualitative coding and thematic analysis, conducted using NVivo
  • Aymeric Grégoire, Software Engineer II, Lumivero—quantitative data analysis, conducted using XLSTAT

Written and edited by: Abigail Jacobsen, Senior Content Marketing Manager, Lumivero

Tool citations:

Source: Lumivero, The State of AI in Capital Project Decision-Making (2026). Survey of professionals involved in capital project and high-risk investment decision-making, fielded June 17 to August 21, 2026.

How can we help you? Contact us.

magnifier linkedin facebook pinterest youtube rss twitter instagram facebook-blank rss-blank linkedin-blank pinterest youtube twitter instagram