
When you have countless ingredient combinations and competing flavor ideas, data—not guesswork—reveals what customers really want. Conjoint analysis helps quantify the importance of each cupcake attribute and identify the combinations most likely to win in the market. Using XLSTAT, you can design the experiment, gather preferences, analyze utilities, and even simulate market performance to find your top cupcake.
If you’ve ever found yourself in a heated debate over which cupcake flavor reigns supreme, you already know that opinions in the dessert world run deep. But what if we could settle the debate scientifically? With a little help from data—and a lot of cupcake recipes—we can actually measure what people love most and the importance of attributes in their choices.
Welcome to the baking experiment where spreadsheets meet sprinkles.
Cupcakes are wonderfully creative desserts. Between textures, flavors, toppings, and dietary considerations, the number of possible combinations skyrockets quickly.
If you were to create every possible variation and ask customers to test them all, you’d hit a major problem: the number of combinations grows exponentially, and human cognitive capacity does not.
For example, just five attributes with three levels each results in 243 possible cupcake profiles—far more than anyone can reasonably taste (or rank!) in one sitting.
Conjoint analysis solves this challenge by helping researchers understand how people make trade-offs between product attributes. Instead of testing every product variation, participants evaluate a carefully designed subset of profiles that still preserves strong statistical properties.
Simple definition:
Conjoint analysis presents respondents with a series of product profiles—each combining different attribute levels—and asks them to rank, rate, or choose among them. From this, we estimate how much each attribute contributes to preference (importance) and how desirable each level is (utility).
This method works perfectly for cupcakes because it:
XLSTAT supports two conjoint methods:
For this example, we use Full Profile analysis with ranking data.
For our cupcake test, we include:
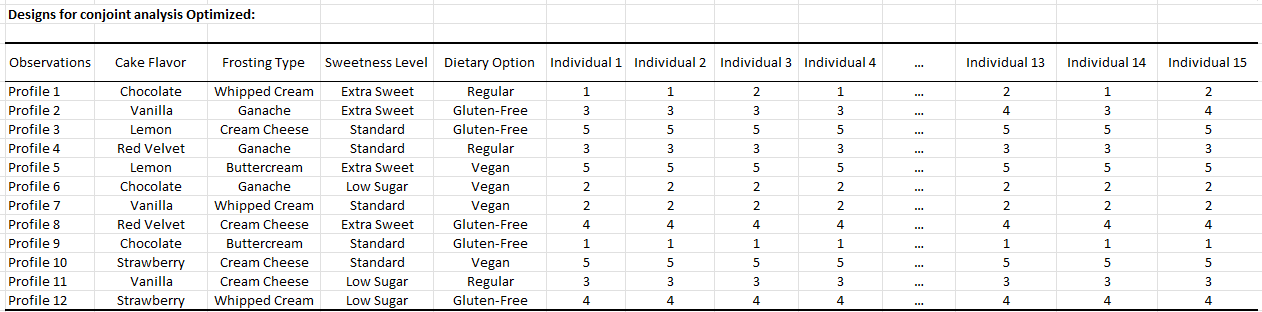
XLSTAT’s experimental design tools reduce the number of profiles to a manageable, statistically valid set. Respondents rank each profile, with lower numbers meaning higher preference.
After collecting rankings, we enter them into XLSTAT’s Conjoint Analysis tool to compute attribute importance and utilities.
Conjoint analysis gives us two core outputs:
This tells us which attributes matter most in shaping preference.

Flavor dominates decision-making, while dietary restrictions matter less for most respondents.
Utility values show how each level influences preference—positive values boost desirability; negative values reduce it.
The chart below displays part-worth utilities from a conjoint analysis, where each bar represents the relative preference value for different attribute levels. Here, the chocolate flavor is a clear preference driver, while lemon and strawberry flavors are significant detractors.

A few highlights:
Using these utilities, we can calculate the total preference score for every cupcake profile.
Top performer:
Profile 9 – Chocolate, Buttercream, Standard Sweetness, Gluten-Free
Total utility: 2.373 (highest among all profiles)
Once you have utilities and attribute importance, XLSTAT allows you to simulate how different cupcake profiles might perform in the real world. Using market simulation tools, you can:
Explore how simulation enhances your conjoint analysis.
XLSTAT makes it easy to move from guesswork to insight with intuitive tools for designing, analyzing, and simulating conjoint studies. Whether you're optimizing a cupcake recipe or refining a full product line, XLSTAT helps you make confident, data-driven decisions.
Explore other ways XLSTAT has powered real-world breakthroughs in our Behind the Breakthroughs series:
Turn data into delicious decisions—buy XLSTAT today.