When building a manufacturing facility, a reliable and resilient power source is key. As social and governmental pressure to decarbonize the manufacturing sector intensifies, more companies are moving away from fossil fuel-powered plants – for example, a 2024 article in Automotive Manufacturing Solutions notes that major automobile manufacturers in Europe, Asia, and North America “continue to innovate and adopt green energy practices,” such as plants powered in whole or in part by solar, wind, and hydroelectric energy.
In addition to addressing sustainability, renewable energy can also result in more cost-effective operation in a time of global energy supply turbulence. A March 2024 article in the Engineering Science & Technology Journal observes that “[t]he integration of renewable energy into the manufacturing sector is not just a step towards mitigating environmental impact but also a strategic move that opens up a wealth of opportunities for innovation, competitiveness, and growth.”
However, making the switch to sustainable energy sources comes with its own set of risk factors. In a recent Lumivero webinar, “Illuminating Probabilistic Risk in Renewable Energy,” energy industry consultant Manuel Carmona walked attendees through modeling methods that can help evaluate the different types of operational and financial risks for renewable energy products in manufacturing. In this case study, we’ll discuss the highlights of Carmona’s presentation, define and describe how to use Monte Carlo simulation, and present the risk modeling examples used to make better decisions in the field of renewable energy.
Manuel Carmona is a certified Project Management Institute Risk Management Professional (PMI-RMP) with more than 25 years of experience in managing projects within the energy and technology sectors. As a trainer with EdyTraining, he has helped manufacturers utilize @RISK and XLSTAT to run Monte Carlo simulations using Excel – simulations that can be used for various types of probabilistic analysis.
Probabilistic analyses can be used to answer a wide range of questions raised at the outset of a renewable energy project, including:
To generate these analyses, Carmona recommends building models using @RISK by Lumivero, a probabilistic risk analysis tool that lets you create Monte Carlo simulations while using Excel spreadsheets.
Monte Carlo simulation is a statistical analysis technique first developed by scientists working on the Manhattan Project during World War II. It’s used to create probabilistic forecasts that account for risk and random chance within complex systems. Finance, meteorology, insurance and defense are just a few of the industry sectors that make use of Monte Carlo simulations to inform decision making.
Powered by software such as @RISK, Monte Carlo simulation can quickly generate thousands of simulations using random numbers that account for a wide range of variables, generating many different outcomes along with the probability of their occurrence.

Creating probabilistic analysis models with a Monte Carlo add-in for Microsoft Excel is typically a simple process that generates a complete range of possible values as opposed to traditional deterministic modelling techniques.
Most analysts use single-point estimates (also known as mean values or most likely values) for their estimations, then perform a series of best- and worst-case scenario calculations using formulas to determine the impact of a specific variable on a project.
For example, an analyst might begin their calculations by setting the cost of building an energy plant as high as estimates indicate it will go, generate an output, and then work in increments to gradually define potential impacts of a project. Manually adjusting the parameters for each calculation allows for refinement of the outcomes, but it cannot produce a complete range of potential outcomes.
With Monte Carlo simulation, analysts can develop comprehensive risk analyses more quickly – analyses that project risk into the future to determine whether an investment is worth making. These analyses can also be adjusted to model many different types of risk or uncertainty including cost assessments across the life of a project.
With @RISK, project managers can build models and run thousands of simulations under different scenarios – allowing them to quickly model probabilities across a wide range of variables. Plus, the interface allows for rapid generation of graphics that help stakeholders visualize findings. Options include tornado graphs showing advanced sensitivity analysis, stress testing, scatter plots, and more.
Carmona notes that because @RISK integrates with Microsoft Excel, creating a probabilistic analysis is as simple as selecting any other Excel pre-programmed function – making the creation of models a straightforward process. By integrating these various uncertainties into a comprehensive @RISK model, project managers can perform Monte Carlo simulations, running thousands of iterations to assess a project's financial performance under different conditions and scenarios.
This approach provides valuable insights to project stakeholders into the range of possible outcomes, the probability of meeting certain financial targets, and the identification of critical risk factors that may significantly impact the project's success and objectives.
Carmona demonstrated how @RISK could be used to analyze uncertainties and costs for building a renewable power plant for a manufacturing facility. The model plant would utilize solar panels and wind turbines to generate energy and would need to reliably produce eight to 12 megawatts (mWh) of energy per day.
For the purposes of this exercise, Carmona assumed that the plant was well-sited and that its solar panels and turbines were appropriately sized. The first question to answer was: based on probabilistic analysis, how much power would the plant usually generate in a given day?
To begin answering this question, it was necessary to develop models that incorporated different types of uncertainty. The analysis began by looking at the solar plant. Three variables that could impact energy generation include:
Using power output data from the solar panel manufacturer and weather data for the city in which the plant was to be built (Madrid, Spain), Carmona used @RISK to generate a distribution curve for power output based on solar irradiation. On a completely cloudless day, the plant could be expected to produce 12–13 mWh of power during daylight hours. Given typical weather conditions at the site, what would the power output of the plant most likely be?

Carmona used the @RISK add-in to simulate a dynamic environment with cloud cover that changed throughout the day with Monte Carlo simulation using random variables. Before running the simulation, he defined the cloud cover using a standard distribution. This required some adjustment to ensure that the model did not generate cloud cover values greater than 100%.
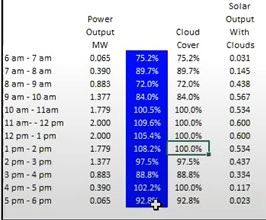
Cloud cover was not the only variable to account for, however. Temperature impact the power output of a solar cell as well – the higher the temperatures, the lower the output. While a perfectly cloudless day should result in maximum power output, an exceptionally hot day can actually impair generation. The model therefore needed to account for temperature correction.
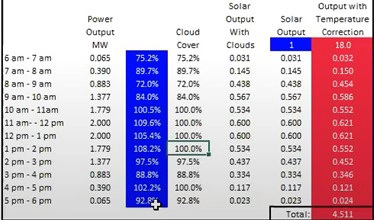
Since @RISK utilizes the Latin hypercube method, a statistical sampling technique that cuts down on computer processing time, Carmona was able to quickly run 100,000 Monte Carlo simulations. A plot of the results was generated, resulting in a probability distribution curve for the daily production of electricity. The simulation projects that on 47.9% of days, energy production would be within the desired range between 11 and 13 mWh.

The next variable to account for was equipment. Power generated by renewable energy means still needs to travel from where it is generated to the facility it needs to power, and sometimes external equipment, such as electrical transformers, may fail. There are also other types of failure events to consider such as damage to solar panels from hailstorms, module soiling, and vegetation overgrowth. The next stage of the probabilistic analysis process was to model for these types of external failure events.
Carmona allowed for four failure events – one that happens every 250 days of operation, one that happens every 500 days, 750 days, or 1,000 days. In every instance, a failure event means that the plant does not provide any activity for the rest of the day.

Using @RISK, Carmona ran a second series of simulations that accounted for external failure events, then generated a new distribution graph to show how these new variables could further impact the probability that the plant would produce enough power on a given day. The red bars indicate the original simulation; the blue the second simulation. This second visualization clearly shows that failure events were likely to reduce the probability of the plant producing enough energy by 3%.

The model shows that on most days the solar plant would be able to produce around 9 MWh of power on most days.
So far, the probabilistic models indicated that the solar plant would not be able to produce enough electricity to meet demand on most days. However, adding wind generation would allow the factory to charge storage overnight when the plant was not producing.
Modeling the power outputs for the wind plants followed a similar process to modeling solar output. This process included gathering weather data about average wind speeds in the area where the plant was to be built and manufacturer data about how much power the turbines generate at a given wind speed. The chart below shows what percentage of output the wind turbines generate (Y-axis) given a specific wind speed (X-axis). Note that faster wind speeds will actually hinder power generation after a certain point, just as a day that is sunny but also very hot will reduce the effectiveness of solar panels.

After running simulations for the wind plant, Carmona was able to demonstrate that the combination of both generation methods – wind and solar – had a high probability of meeting electricity demand on most days.

That accounts for the actual power generation issues. What about the costs of operating and maintaining the plant?
Carmona decided to conduct a NPV analysis comparing the lifetime cost of operating the renewable energy plant with performance-monitoring software involved. Without the monitoring software, the plant performance would be lower than with the monitoring software. With the software, the plant would produce approximately 6% more energy. Does licensing and operating the monitoring software result in actual saving over time?

The table below was used to generate a 13-year forecast that also accounted for estimated plant inspection and maintenance costs, which would take place every three to four years.

Then, Monte Carlo analysis was performed to generate an average NPV. This showed that the average NPV of the plant without the monitoring software would be €134,000, while the average NPV with the monitoring software would be approximately €169,000 over the same period.

The result: running the plant with monitoring software would result in an average savings of €35,300.
What about the risks and costs involved with building the plant? Fortunately, DecisionTools Suite’s ScheduleRiskAnalysis allows project managers to assess time and cost uncertainty. The program can import details of projects that have been scheduled in either of two popular project management tools: Microsoft Project or Primavera P6 from Oracle. Project managers can use @RISK to import their project schedules into Excel and carry out Monte Carlo simulation to determine the impact of construction delays or cost overruns.
For renewable energy projects, @RISK empowers project managers and decision makers to make informed choices by generating Monte Carlo distributions in Excel. From determining power output to evaluating the value of investing in add-ons like monitoring software, @RISK can help you develop robust probabilistic analyses for a variety of risks and provide clear visualizations of results.
Find out how you can generate better risk analyses for your renewable energy projects – or any other projects – within Microsoft Excel. Request a free trial of @RISK today. You can also watch the full webinar on-demand!
SOURCES
Energy Risk Modelling, Roy Nersesian.
Manuel Carmona, Edytraining Ltd.
Researchers used @RISK and PrecisionTree to model the likelihood of a successful evacuation during a volcano eruption.
University of Bristol’s Environmental Risk Research Centre (BRISK) adds new dimension to modeling volcanic risk in Guatemala.
Conducting a quantitative risk assessment is often a difficult process, requiring data that is sparse or even unobtainable. With volcanoes, the effects of uncertainty are accentuated by the potentially high costs of making a wrong call.
Guatemala has many active volcanoes, but none are as close to large populations as the ‘Volcán de Fuego’, potentially one of the most dangerous volcanoes in Central America with a large population surrounding it. Many farmers live and work in its shadow due to the fertile slopes that provide the best ground for coffee growing in the region. Large eruptions in 1974 fortuitously did not lead to any deaths, but buried in the volcano’s geological history are signs of ominous behavior.
The volcano has been very active over the last few years with many small eruptions taking place every day, and the fear that this activity could suggest the build up towards larger eruptions in the future is a worrying prospect. The “Instituto Nacional de Sismologia, Vulcanologia, Meteorologia e Hidrologia” (INSIVUMEH), regularly monitors activity at the volcano, however, despite the gallant efforts of the scientists there, no formalized risk assessments are carried out, mostly due to lack of funding and resources.
Recent work using Lumivero's DecisionTools Suite however, is now enabling volcanologists to quantify the nature of one of the threats from the volcano to peoples’ lives. As an integrated set of programs for risk analysis and decision making under uncertainty, The DecisionTools Suite running in Microsoft Excel, allows access to Monte Carlo simulation and other advanced analytics quickly and simply on the desktop.
Conventional risk assessments attempt to model the probability of a hazard and combine that with the vulnerability of the population, to create societal risk curves and estimated values of Individual Risk per Annum (IRPA). For many of the people living on the slopes and indeed the authorities, knowing the potential number of deaths or cost from an eruption is not entirely useful, as little planning control or mitigation can be carried out. In an attempt to increase the usefulness of the risk modeling to the end-user (the authorities and people living near the volcano), BRISK has looked at the vulnerability in a different way.
Normally volcanic risk assessments assume that the whole population is present in a location when a hazard hits. However, new work by BRISK has modeled the likelihood of a successful evacuation, using both @RISK and PrecisionTree, by inputting several variables obtained through a process of structured expert judgment. These variables, which include the time taken between a possible eruption and a possible hazard hitting a location, along with communication times from authorities and evacuation times, are each estimated with an uncertainty distribution by the experts. These expert views are then weighted and pooled together. The variables are then constructed together in a logic tree within PrecisionTree, with the end node either being evacuation or no evacuation – and the probability of these outcomes being quantified, with their uncertainties. When fed back into the @RISK (Hazard * Vulnerability) model, the effects of a potential evacuation on the risk is very clear.
When looking in more detail at the model outputs from the logic tree, it became clear where the sensitivities were within the system. For example, it may be for a given location that the amount of time between a warning and the hazard hitting is crucial, or it may be that the time taken to evacuate is crucial. This new way of modeling volcanic risk informs better planning and more effective mitigation strategies.
Jonathan Stone, a researcher at the University of Bristol, working with colleagues Prof Willy Aspinall and Dr Matt Watson, said “DecisionTools Suite has proved to be invaluable in the work we are doing with INSIVUMEH, and potentially very useful for those living and working around Volcán de Fuego.”
Professor Willy Aspinall has been using @RISK software for some time in his work analyzing the risk of volcanic eruptions and earthquakes around the globe.
Originally published: Dec. 5, 2020
Updated: June 7, 2024
Pharmaceutical companies can use PrecisionTree (part of the DecisionTools Suite that creates multi-phase decision trees) to investigate the best clinical trial sequencing pathway for a novel drug in pursuit of multiple potential diseases (indications). They can then conduct sensitivity analysis to the dominant decision, determine the maximum cost of an initial proof-of-concept (POC) study, and then communicate findings to executives. This case study analyzed three different strategic alternatives (pathways) for indication sequencing for an anti-inflammatory drug in pursuit of 3 diseases (asthma; inflammatory bowel disease (IBD); lupus erythematosus (LE)):
Drug development is an expensive process that takes place over very long timeframes with high technical risk and commercial uncertainty. Advancing from the drug discovery phase through clinical trials to Food and Drug Administration (FDA) or European Union (EU) approval can take more than a decade and cost hundreds of millions of dollars.
Most modern compounds can be used as therapies for different diseases, and companies must decide on the order in which they will conduct clinical trials for the different diseases a drug may treat. This process, known as indication sequencing, can influence a company’s direction and future success.
Using PrecisionTree to create decisions trees that model the probability of phase-specific success a drug will encounter with treating different diseases and then conducting a sensitivity analysis to determine how far from those probabilities an option can deviate before altering the dominant decision can help companies break down the complexity and uncertainty of this decision at each stage of drug development and make informed choices.
Background
Dr. Richard Bayney is President and Founder of Project & Portfolio Value Creation (PPVC), a consulting boutique that provides services, training, and education in strategic planning, decision analysis, and portfolio management. He has more than 20 years of experience in Decision Analysis and Portfolio Management in the pharmaceutical industry with roles at Johnson & Johnson Pharmaceutical Research and Development, Bristol-Myers Squibb, Bayer, and Merck & Co.
He uses PrecisionTree and @RISK, Lumivero solutions contained within the Decision Tools Suite, to help pharmaceutical clients make informed decisions about indication sequencing and drug development.
Using PrecisionTree
When a pharmaceutical company is investigating anti-inflammatory compounds that can treat multiple indications PrecisionTree can help create multiple decision pathways that map out possible strategies for clinical trials, the likelihood of success of each strategy, and the estimated return on investment for each alternative. Three pathways are considered: testing the drug compound for effectiveness in treating asthma first via a Proof Of Concept (POC) trial, testing for IBD efficacy first with its own POC, or testing for LE efficacy first with its own POC.
The decision tree diagrams shown here indicate the following:
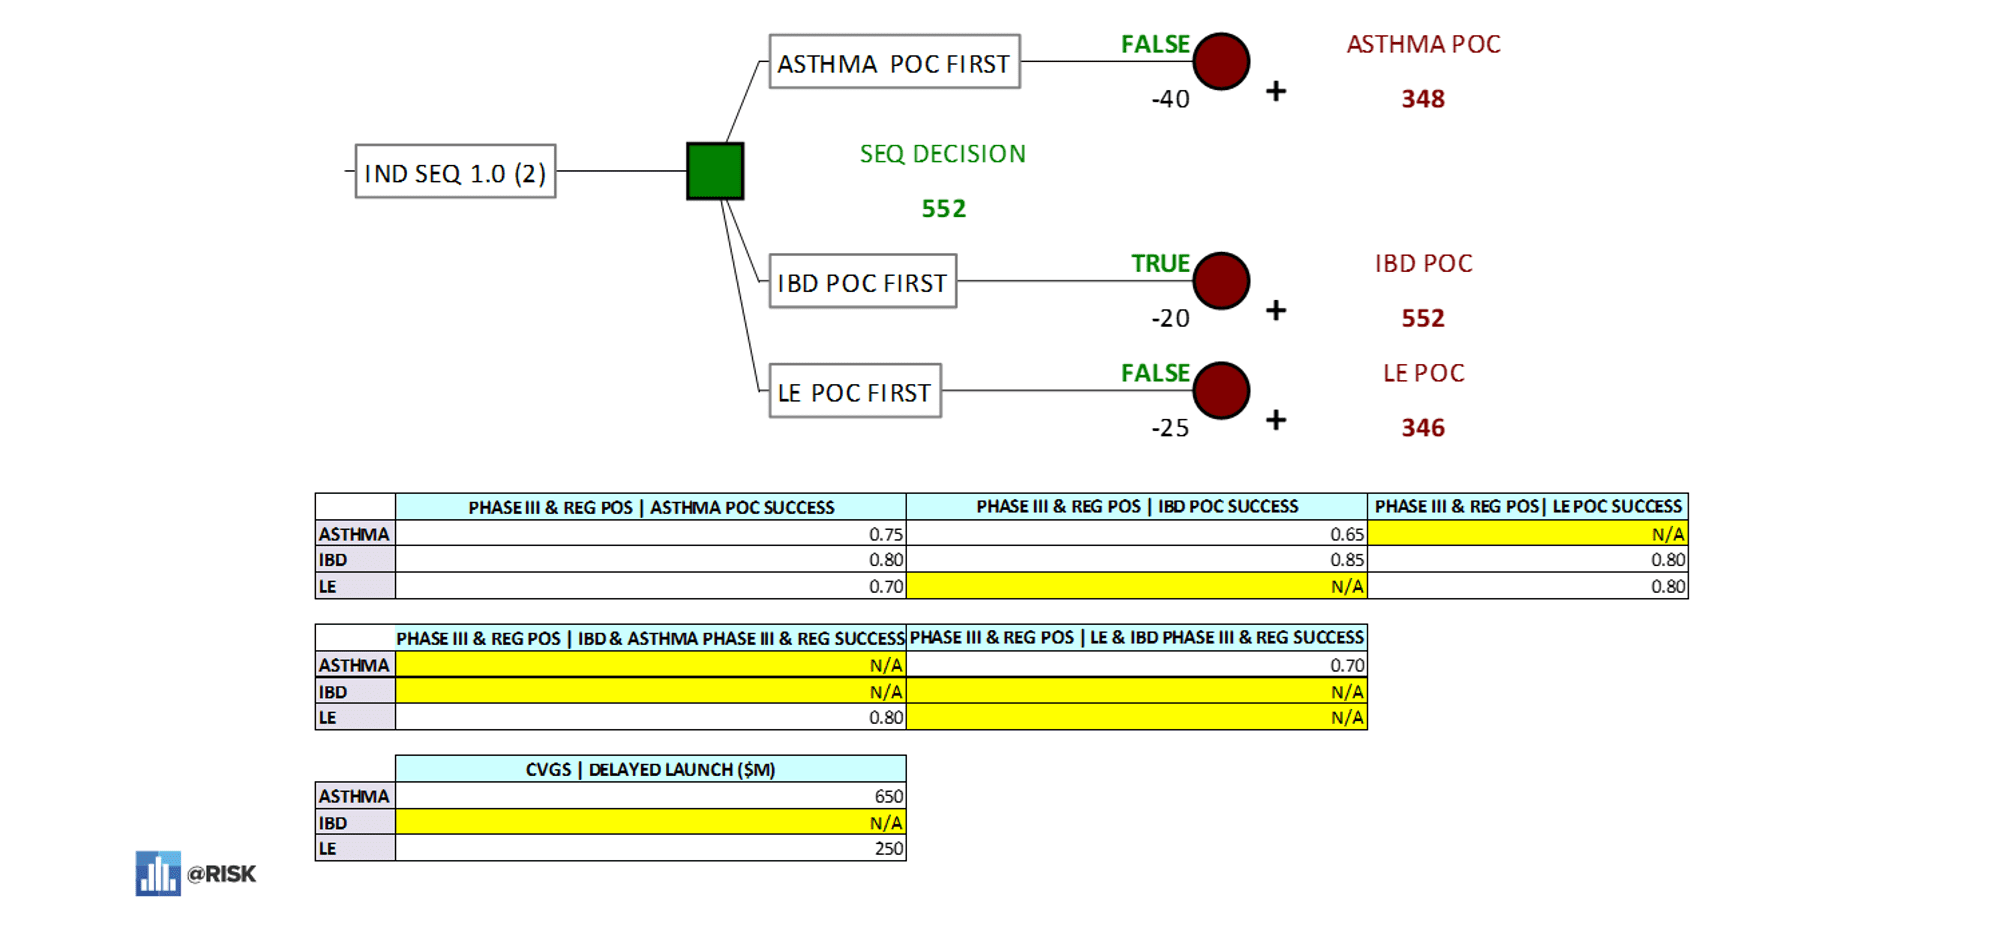 PrecisionTree model with positively correlated risks – well advised since the likelihood of the first indication success influences the likelihood of both second and third indication successes.
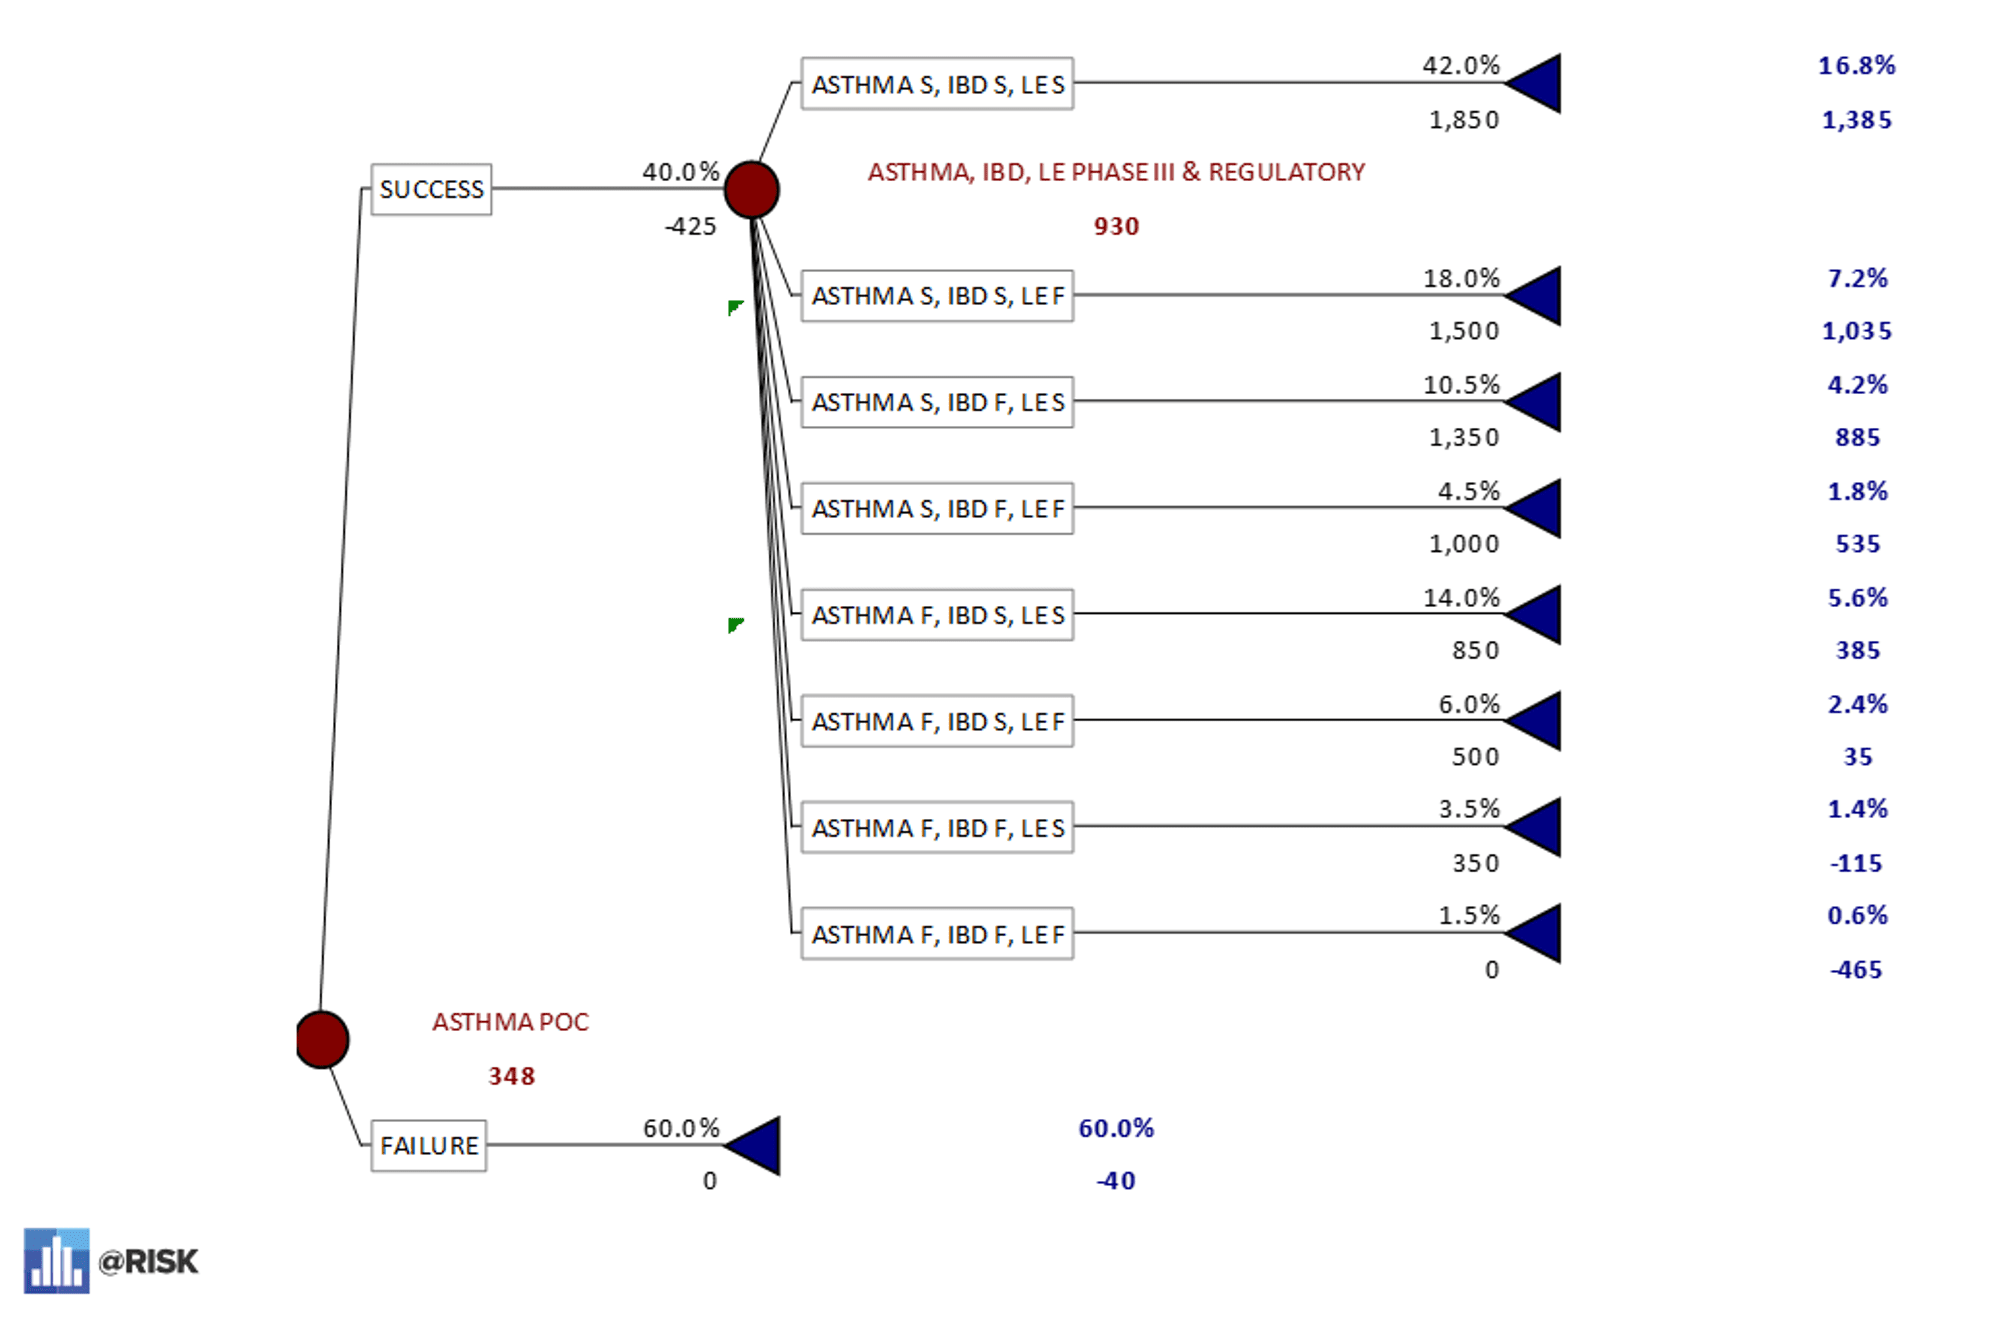 PrecisionTree model asthma POC first – 17% probability of all three indications being successful.
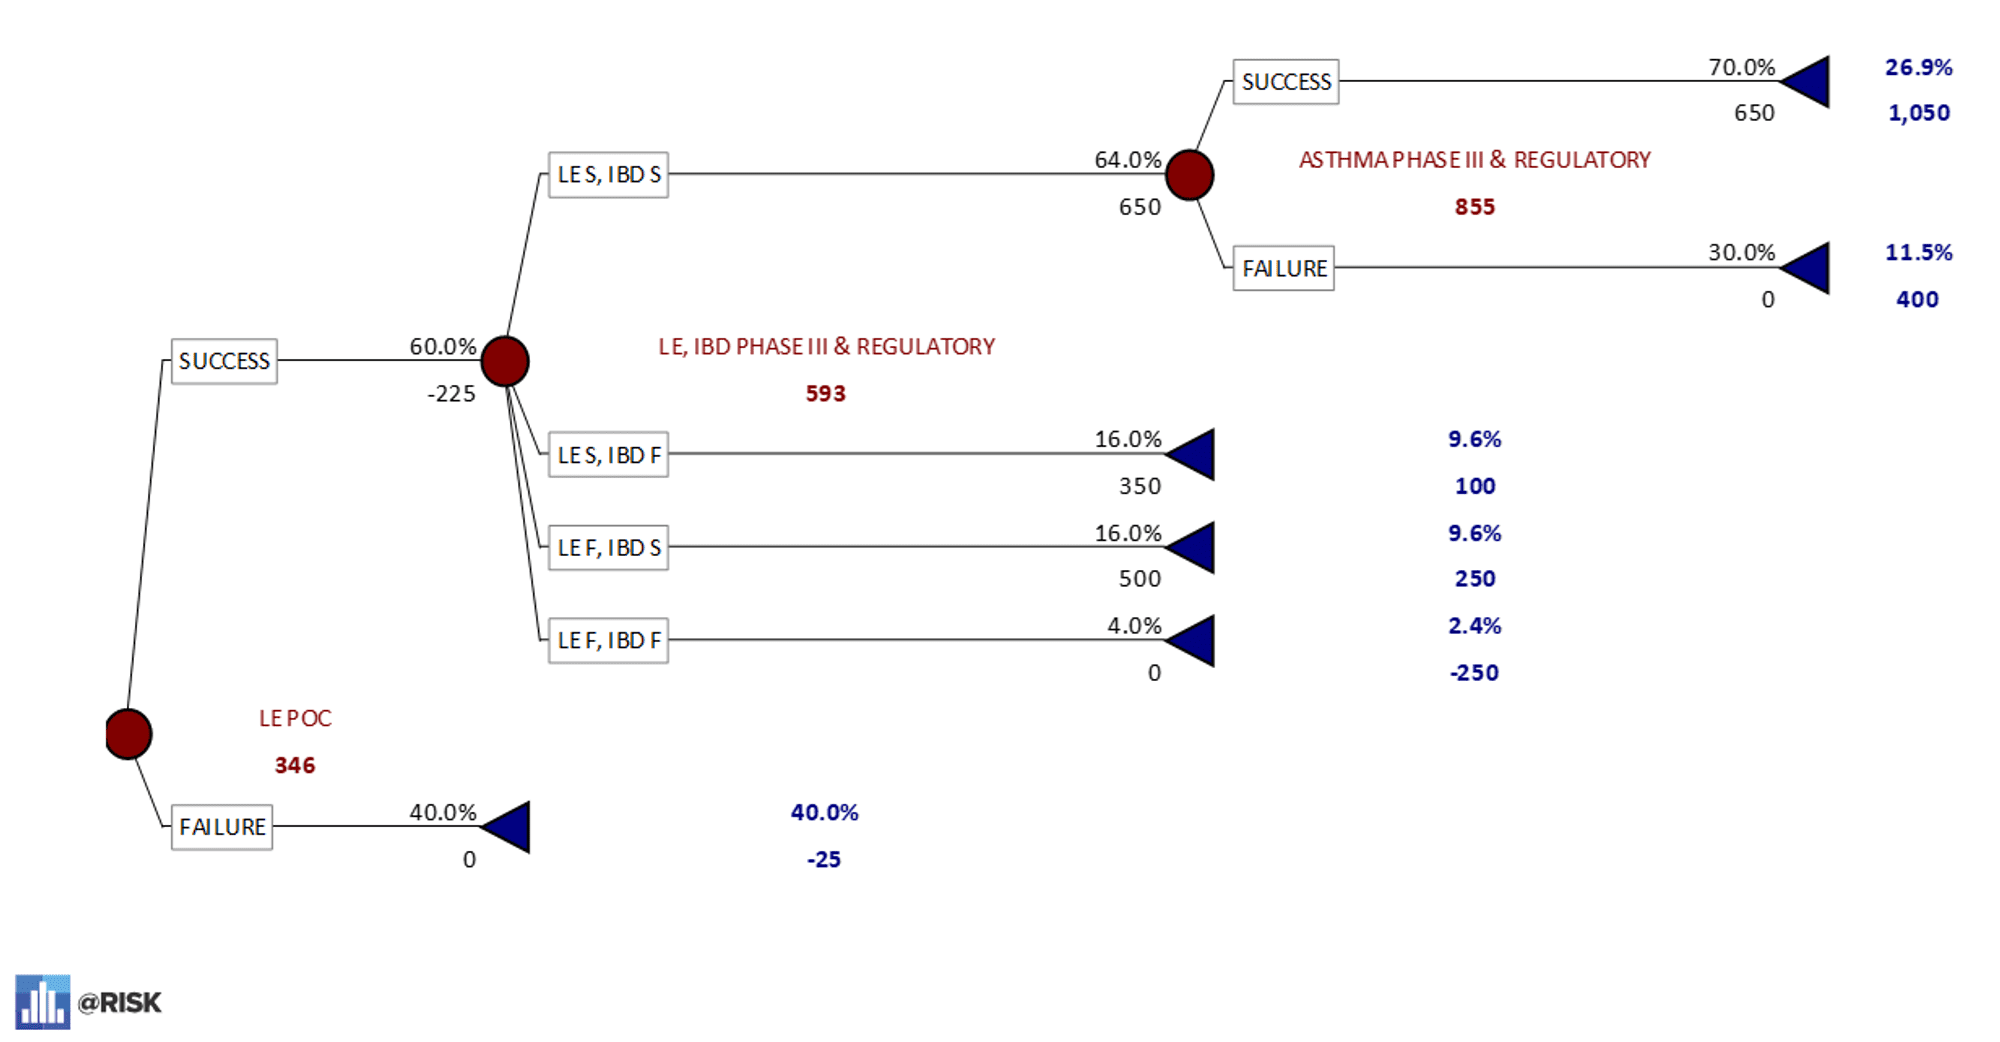 PrecisionTree model LE POC First – 27% probability of all three indications being successful.
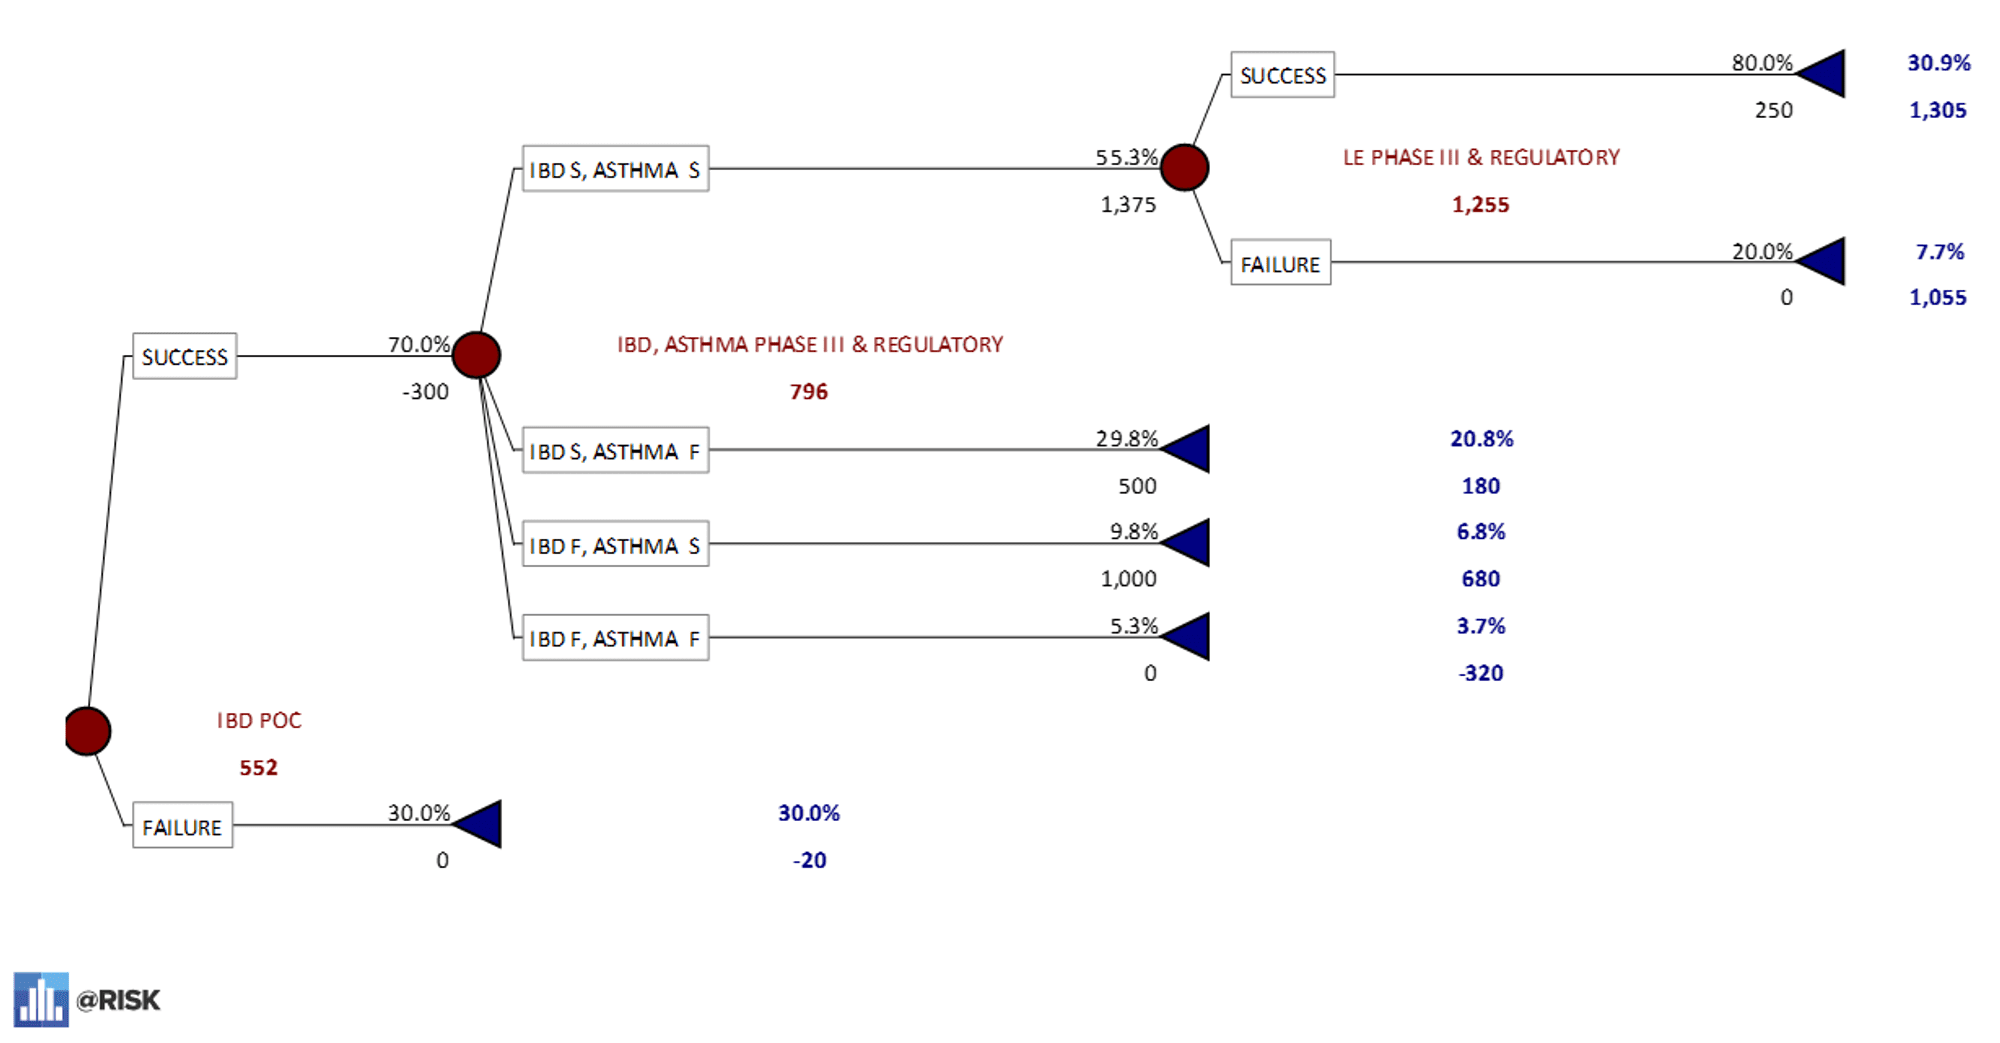 PrecisionTree Model IBD POC First – 31% probability of all three indications being successful.
Once a dominant option has been identified, a sensitivity analysis can help interrogate the robustness of the analysis and determine any breakpoint—e.g. how low a phase-specific judgmental probability of success can go before the dominant decision changes.
In the PrecisionTree model for the IBD-first sequence above, the model shows a 70% chance that the drug under investigation will be successful in treating IBD during the POC phase. The illustration below shows how low that percentage would need to drop before one of the other pathways became a better option. The expected value of the IBD-first sequence only drops below the expected values of the other two decision pathways when the probability of success of the IBD POC phase is lower than 45%.
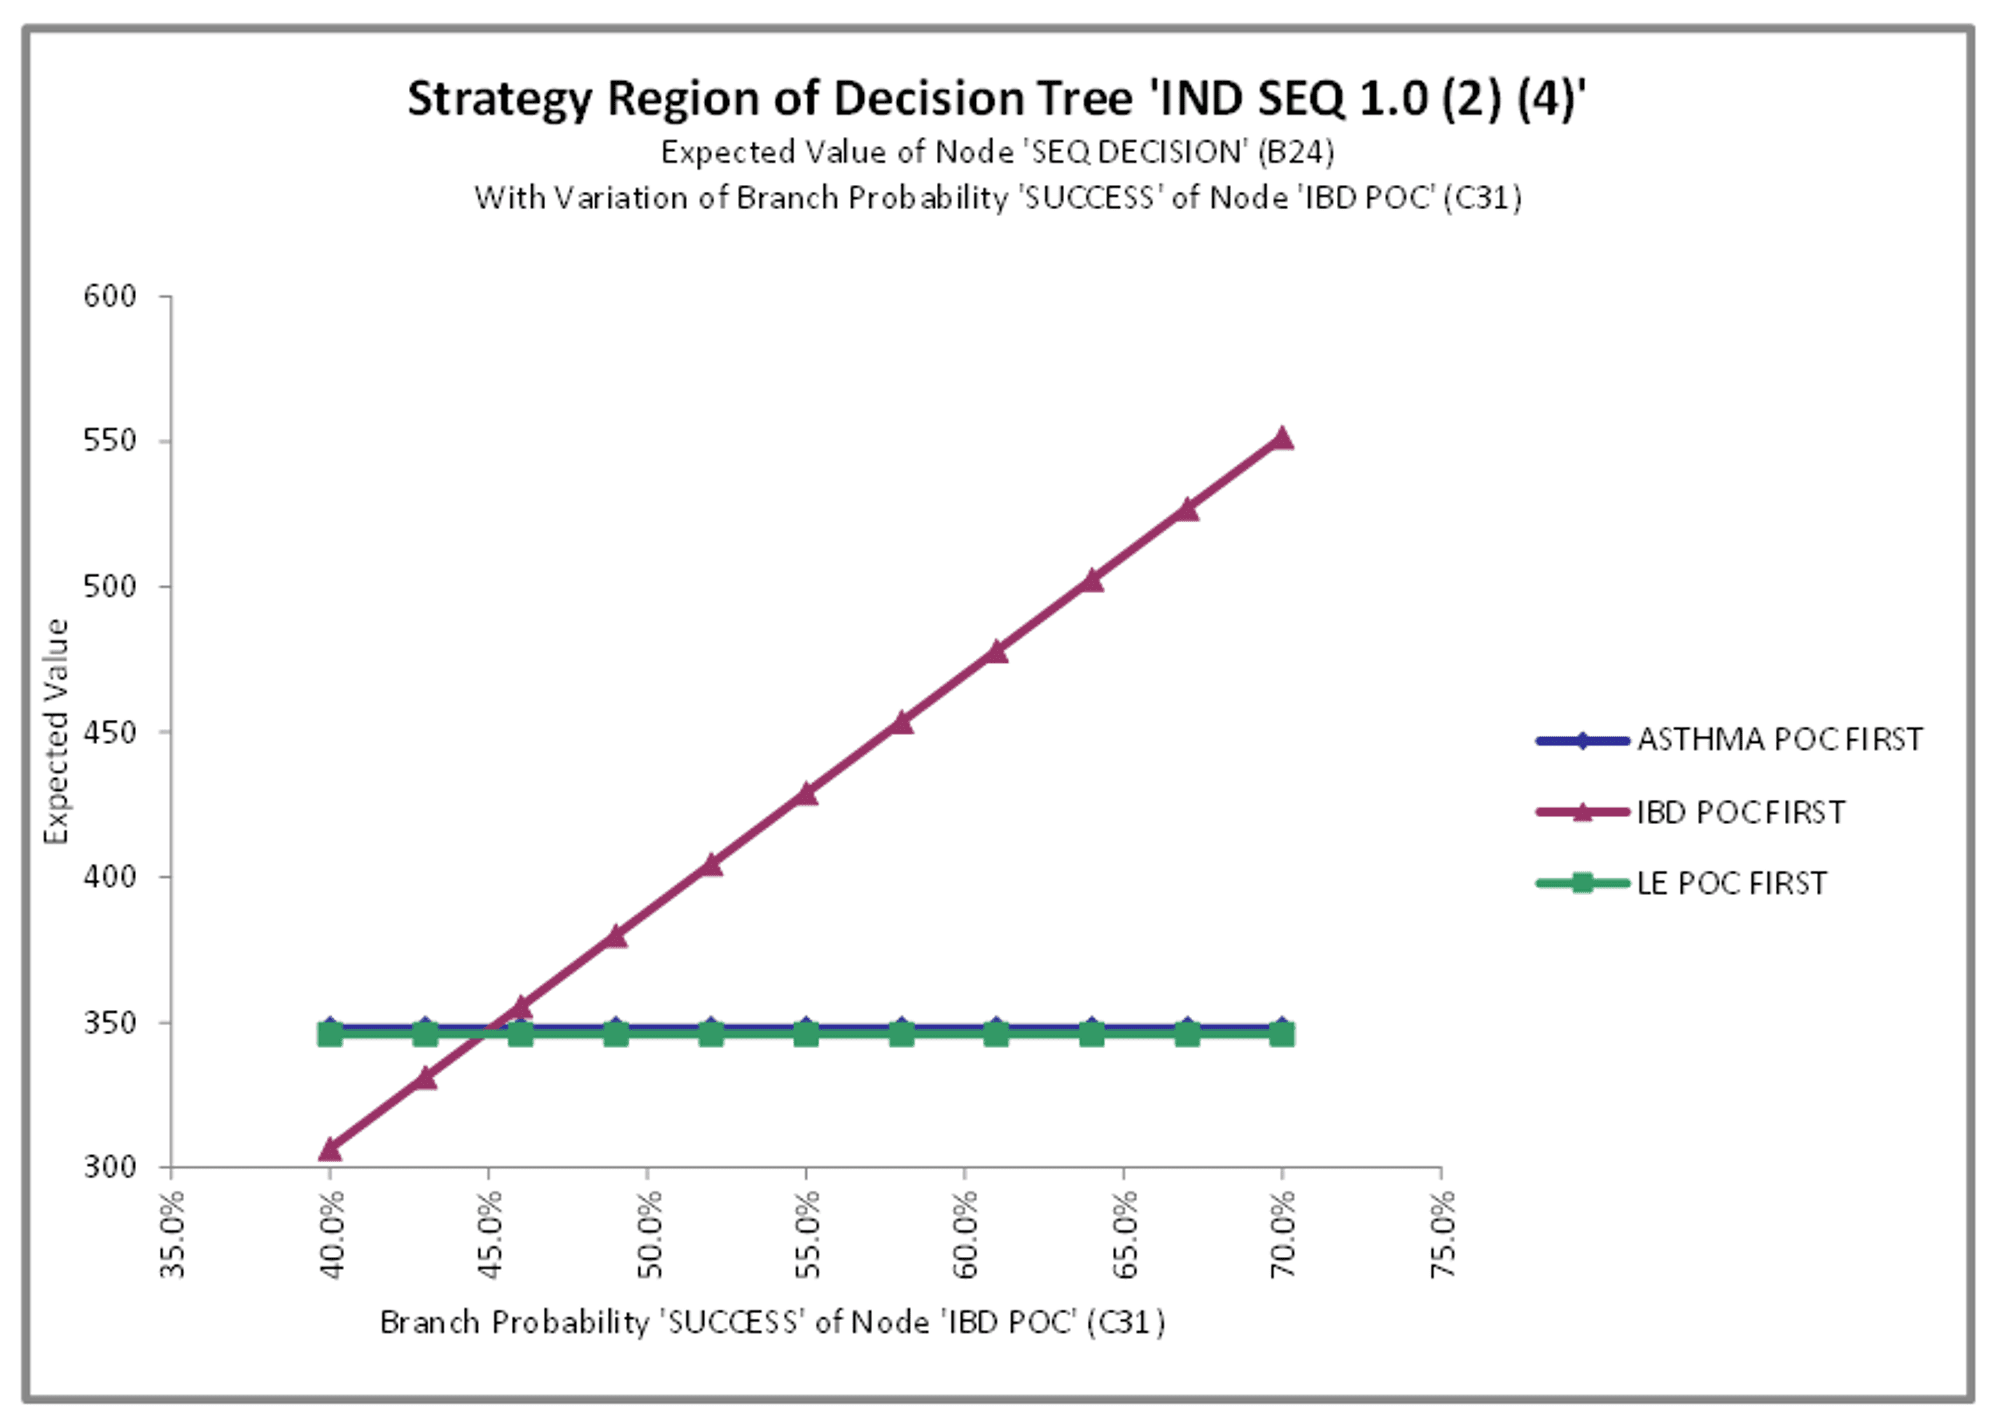 Strategy Region of Decision Tree “IND SEQ 1.0 (2) (4)’. Sensitivity analysis to IBD POC probability of success (POS).
This process can also be used to conduct any two-way sensitivity analysis, e.g. looking at the potential breakpoints for the combined probability of success of the IBD POC and the follow-up phase, Phase III, that involves testing the drug for statistical effectiveness against asthma as well. This generates a different strategy region visualization that allows for identification of breakpoints based on two variables.
PrecisionTree makes it possible to test the conditional probability of success based on prior information in a process known as Bayesian Revision — a statistical calculation based on a theorem developed by the 18th-century mathematician William Bayes. In clinical practice, attending physicians routinely prescribe diagnostic assessments to revise their prior judgments that patients displaying symptomatic illness are afflicted by one condition or another. Based on the historical sensitivity and specificity of such diagnostic techniques, they will then revise their clinical judgments that may result in altered treatment.
In the case of pharmaceutical indication sequencing, Bayesian Revision can help determine how much to pay for the initial POC study for the IBD decision sequence. In this case, a prior judgment (prior probability) of Phase 3 success is estimated at 20% (bottom arm of decision tree) but is revised (posterior probability) to almost 37% if the IBD POC study is successful with its own judgmental probability of success of 38% (upper arm of decision tree).
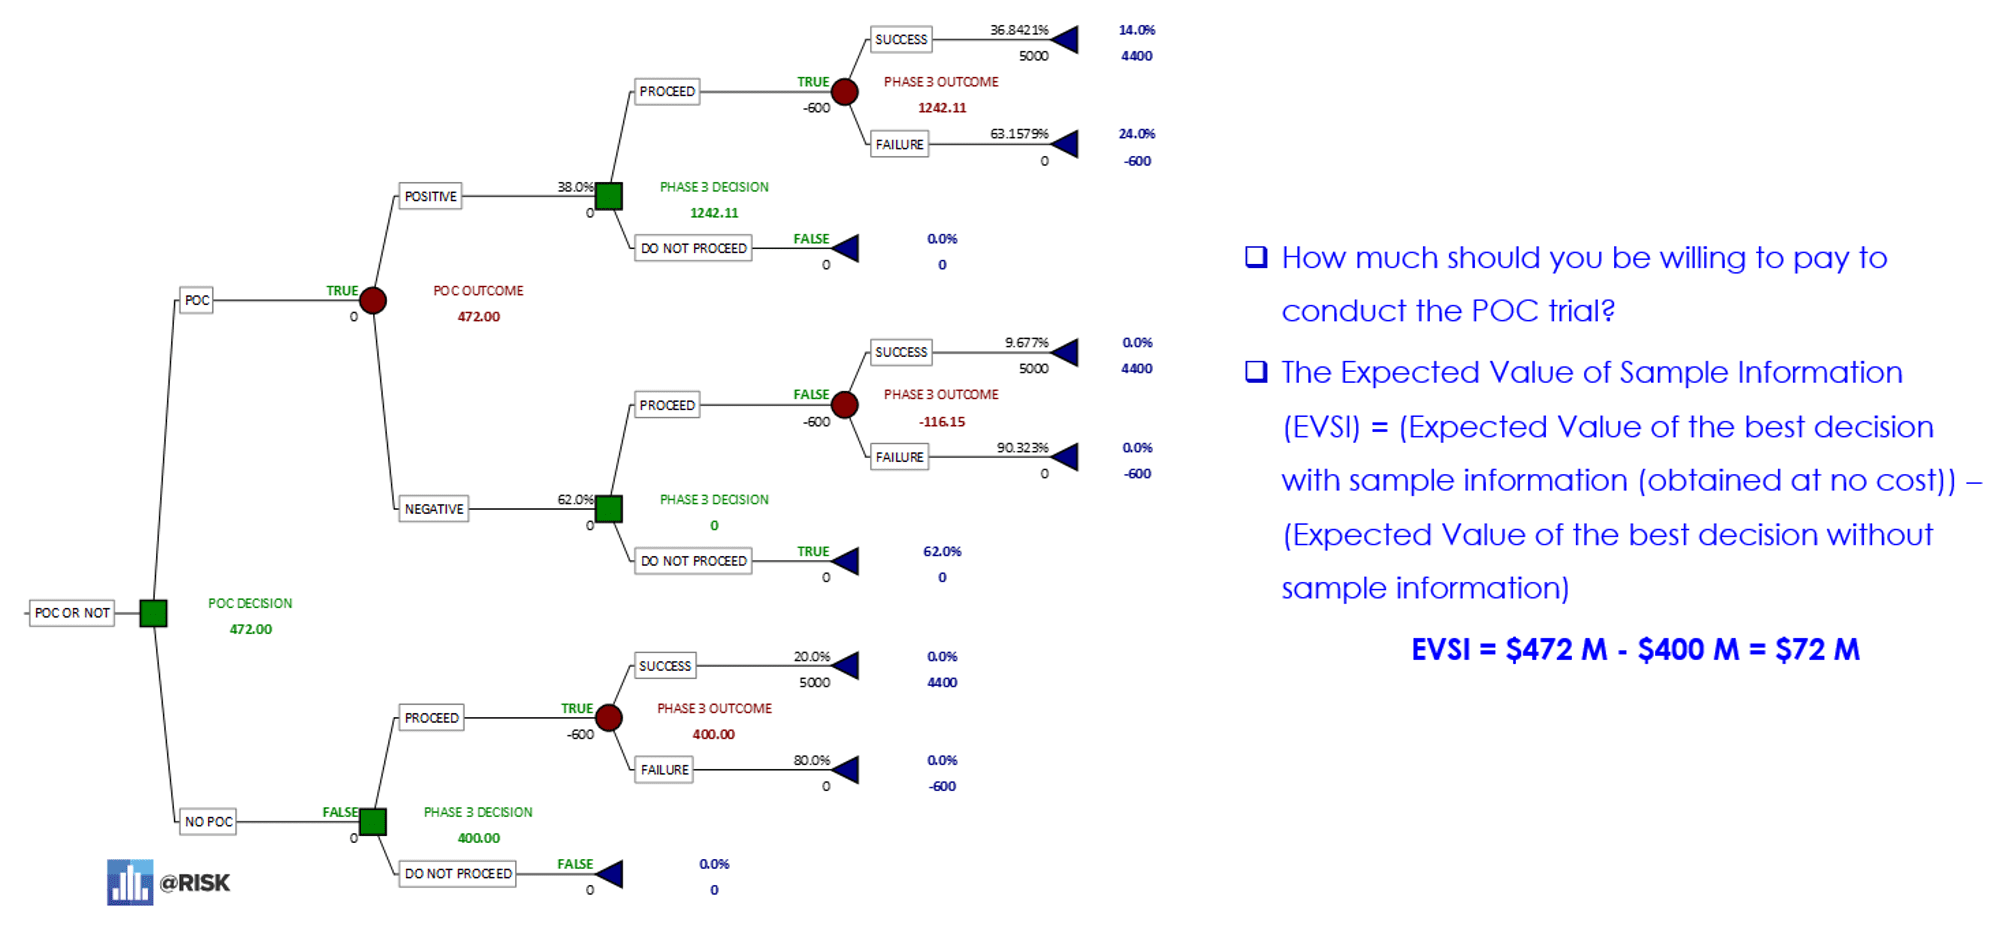 Expected Value of Sample Information – determining how much to pay for a POC study that is informative but imperfect (ll).
The illustration above shows the expected values for a Phase III trial result conducted with a POC study (upper decision node) and the expected values for a Phase III trial result without a POC study (lower decision node). The expected value of sample information (ESVI) can be determined by subtracting the value of the lower node from the upper node. In this case, the result is $72 million.
PrecisionTree identified the dominant indication sequencing strategy, provided a sensitivity analysis across multiple parameters, and even allowed for an estimate of the maximum amount the drug developer should be willing to pay for a POC study.
PrecisionTree has allowed Dr. Bayney to use decision trees in Excel to decompose the complexity of indication sequencing phase by phase. By conducting probabilistic analysis for different indication sequences, determining breakpoints through sensitivity analysis, and estimating the costs of conducting an initial POC study, PrecisionTree makes it possible to offer pharmaceutical executives the information they need to make the best possible decisions under conditions of high risk and uncertainty when scheduling clinical trials that will impact a company’s direction for years.
To get started fast, download our free example model, Portfolio Evaluation of Multi-phase Project and a free 15-day trial of DecisionTools Suite. This interactive example model looks at cash flow of projects with multiple phases such as those typically found in the pharmacological industry.
Interested in learning more about how PrecisionTree, included in DecisionTools Suite, can help guide your pharmaceutical indication sequencing? Request a free demo today!
You can also join the Lumivero community to connect with current PrecisionTree users and discuss how they’ve used it to improve their decision making.
DNV GL is an international organisation for ship classification, safety and quality control. It uses PrecisionTree and @RISK software (part of the DecisionTools Suite, Palisade’s complete toolkit of risk and decision analysis tools) to determine the risk of an incident occurring to a ship or its systems and the consequences should one occur. This enables cost-benefit analysis so that informed decisions can be made about the best strategies to mitigate risk events.
Formed from the merger of DNV and Germanischer Lloyd, DNV GL is the world’s largest ship and offshore classification organisation, the principle technical advisor to the global oil and gas industry, and a leading expert for the energy value chain including renewables and energy efficiency. The company offers a wide range of independent technical expertise including surveying and the safety certification of ships, offshore structures, wind turbines and other industrial units, as well as the certification of quality systems.
DNV GL’s core purpose is to safeguard life, property and the environment by enabling its customers to advance the safety and sustainability of their business.
In this context, DNV GL is a key player in major research and development projects for the shipping industry. A core element of their focus is enhancing safety and security in shipping by pro-active use of risk assessment and cost-benefit techniques.
A key activity for DNV GL’s Safety Research unit on national, international and internal projects is risk assessment for ships and ship systems. The aim is to identify risk reduction measures and deploy cost-benefit analysis to determine their economic feasibility. For instance, navigational aids will reduce the probability of collision and grounding accidents, while damage stability measures will limit the consequences of such an event, should it occur.
Risk assessments in recent years have differentiated ships by type, such as containership, crude oil tanker or general cargo ship. Each project sees the development of quantitative risk models, which can represent larger groups of the world fleet and the evaluation of the risks using internationally-agreed processes. Most projects are carried out in accordance with the Formal Safety Assessment (FSA) process developed by the International Maritime Organisation (IMO), which specifies the relevant steps for risk analysis, risk evaluation and risk reduction. Typically this requires the development of quantitative risk models that use fault trees for modelling the causes of events, and event trees to model the consequence sequences resulting from initial accident events.
DNV GL’s Safety Research unit uses Palisade’s decision tree software, PrecisionTree, to develop the risk models that apply to: (1) crew; (2) environment; and (3) property. (Risk to persons is usually quantified in terms of ‘potential loss of life’ or individual risk to the crew or passengers. Risk to the environment refers to potential damage by events such as oil spills or release of dangerous cargo. Risk to property relates to loss of, or damage to, the ship.)
In the case of investigating the risk for a specific ship type, typically the overall risk model contains sub-models addressing five accident categories: collision; contact; fire/explosion; grounding; and foundering. Each sub-model describes the relationship between the initial incident (e.g. an accident such as a collision between two ships) and the consequences. These models are based on ‘high-level’ event sequences, as illustrated in Figure 1.
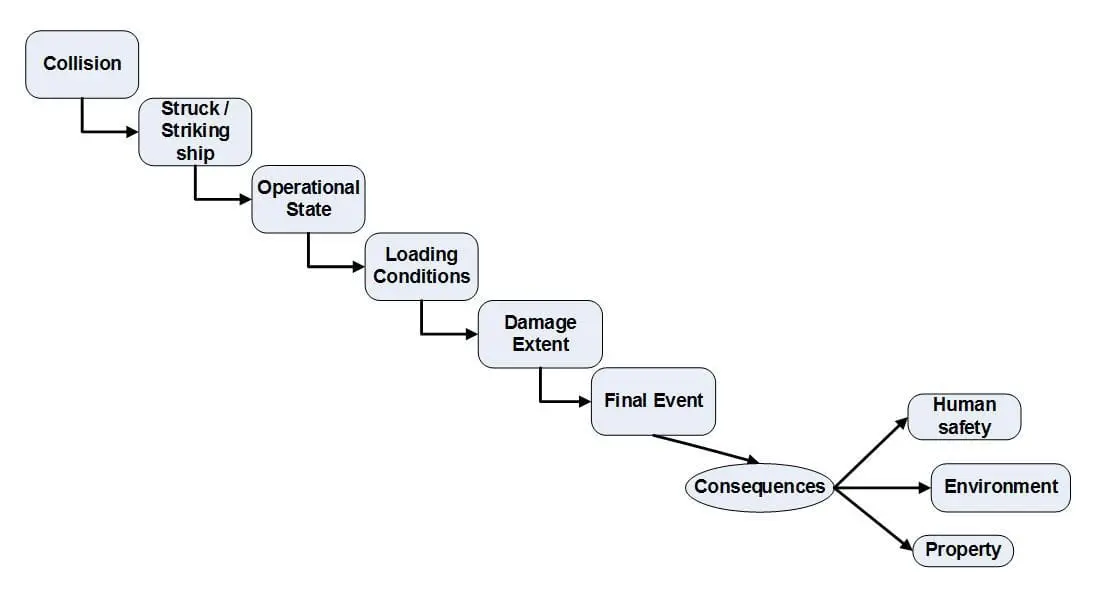
Generic high-level event sequence for collision risk model
In order to limit the complexity of the risk model, representative scenarios are developed. The consequences assigned to the scenarios also consider a limited number of potential outcomes that are regarded to be representative for that specific scenario. For instance, the amount of oil spilled due to cargo hold damage will vary depending on factors such as: where on the ship the damage occurs (i.e. the number of cargo holds damaged and whether these are above or below waterline); the subdivision of cargo tanks (volume per tank); whether the tanks are filled to full capacity; and the density of the oil. In the risk model this variety of consequences will be represented by, for instance, two spill sizes.
The sequences in DNV GL’s PrecisionTree event trees are populated with occurrence probabilities (e.g. dependent probability that a ship in a collision is struck) that are derived from analysing casualty reports. These reports provide results from ship accident investigations and are available on a commercial basis or from publicly-available databases such as IMO Global Integrated Ship Information System (GISIS). Alternatively, casualty estimates can be developed using numerical models such as probabilistic damage models (estimating the probability of a certain level of damage and how likely the ship is to survive this) or passenger evacuation simulation (the modelling of passenger flow on board a vessel to estimate the percentage of passengers evacuated in a given time interval).
However, although databases provide key input for the development of quantitative risk models, they have also some shortcomings, including:
This results in increased uncertainty in the parameter values used in quantitative risk models.
In order to consider this uncertainty and make it visible in risk evaluation and cost-benefit assessments, DNV GL’s Safety Research unit uses @RISK to perform Monte Carlo simulation. This factors in the uncertainty of input parameters for the risk models, and illustrates the impact on the estimates provided for the assessment of a current level of risk, as well as the cost-efficiency of risk-mitigating measures.
PrecisionTree and @RISK are part of the DecisionTools Suite, Palisade’s complete toolkit of risk and decision analysis add-ins for Microsoft Excel. The software tools work together to help DNV GL’s Safety Research team get essential insights from their data.
“PrecisionTree makes it straightforward to quickly develop event trees. These are essential to our analysis when looking at how to reduce the both the number of shipping incidents and the consequences should they occur,” explains Dr. Rainer Hamann, Topic Manager Risk Assessment, Safety Research at DNV GL SE. “At the same time we have to be realistic about the accuracy of our data inputs and, by means of distributions and Monte Carlo simulation, @RISK enables us to be clear about the level of uncertainty contained in each model. Embedded in the Microsoft environment, it also allows us to incorporate standard Excel features, making it easy to use.”
In-depth risk analysis lays the groundwork for cost-benefit analysis – i.e. the assessment of whether the benefits of risk reduction strategies will be higher than the cost of implementing these. Shipping companies can therefore make informed decisions on complex issues on averting fatalities, and avoiding oil spills (with the cost of the latter increasingly taking into account the consideration clean-up costs, economic loss to related businesses such as fishing and tourism).
Risk analysis plays a key role in the design of ships and their systems in order to continually increase levels of safety.
AC Immune SA, a biopharmaceutical company focused on developing product candidates to treat neurodegenerative diseases, harnesses the power of Lumivero's products—specifically @RISK and PrecisionTree, to assess the value of the company’s development candidates leading to the overall enterprise value. Using @RISK, AC Immune calculates the risk adjusted net present values (rNPVs) for its preclinical and clinical drug candidates. Using PrecisionTree, the company values key decisions along the development pathway. Thanks to Lumivero, AC Immune has been able to manage risk, define prediction intervals, communicate clearly to internal stakeholders, and ask more ‘what if’ questions based off their models.
AC Immune SA is a clinical-stage biopharmaceutical company leveraging their two proprietary technology platforms to discover, design and develop novel proprietary medicines and diagnostics for prevention and treatment of neurodegenerative diseases (NDD) associated with protein misfolding.
Misfolded proteins are generally recognized as the leading cause of NDD, such as Alzheimer’s disease (AD) and Parkinson’s disease (PD), with common mechanisms and drug targets, such as amyloid beta (Abeta), Tau, alpha-synuclein (a-syn) and TDP-43. AC Immune’s corporate strategy is founded upon a three-pillar approach that targets (i) AD, (ii) focused non-AD NDD including Parkinson’s disease, ALS and NeuroOrphan indications and (iii) diagnostics. They use their two unique proprietary platform technologies, SupraAntigen and Morphomer to discover, design and develop novel medicines and diagnostics to target misfolded proteins.
AC Immune uses @RISK to assess the Company’s enterprise value, calculating risk-adjusted net present values (rNPVs) for certain preclinical and clinical product candidates. The company then combines each respective value and determines the ultimate “Sum of the Parts” for an overall indication of the company’s price per share. The company uses this internally generated value and bridges to potential variances in their share price (Nasdaq: ACIU) or price targets published by their covering analysts.
Each product candidate that AC Immune elects to value includes many uncertain variables which impact the projected net cash flows in the development and potential commercialization period for the product candidate. The typical inputs AC Immune uses in their @RISK models include, but are not limited to:
“Certain of these variables can be material and are difficult to derive a point estimate for, or can be difficult to otherwise source,” explains Julian Snow, AVP of Financial Reporting.
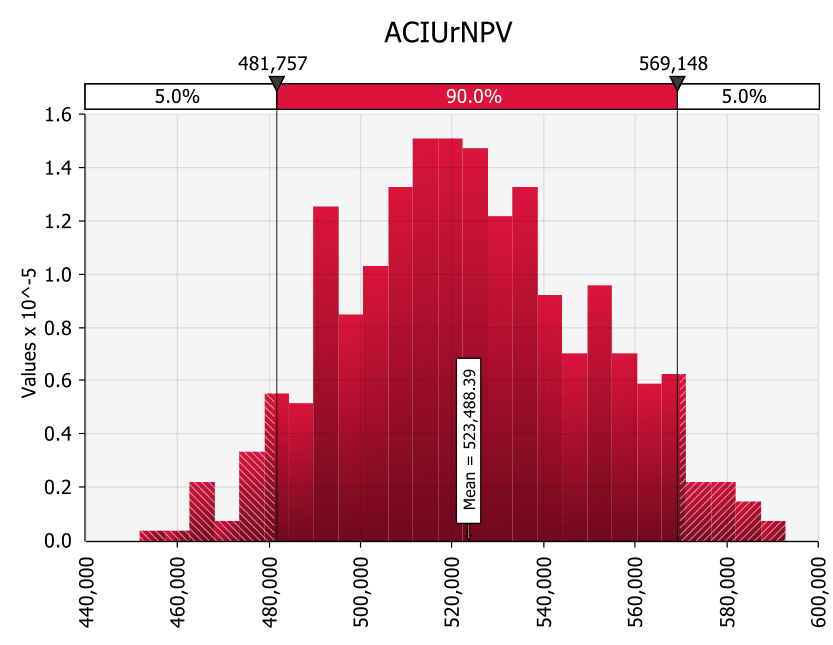
Typically, Snow uses a PERT distribution for his @RISK models for the risk-adjusted NPV. These inform AC Immune of the 90% prediction interval range, given the assumptions. In this example, the mean rNPV is expected to be around CHF 523m (illustrative example only).
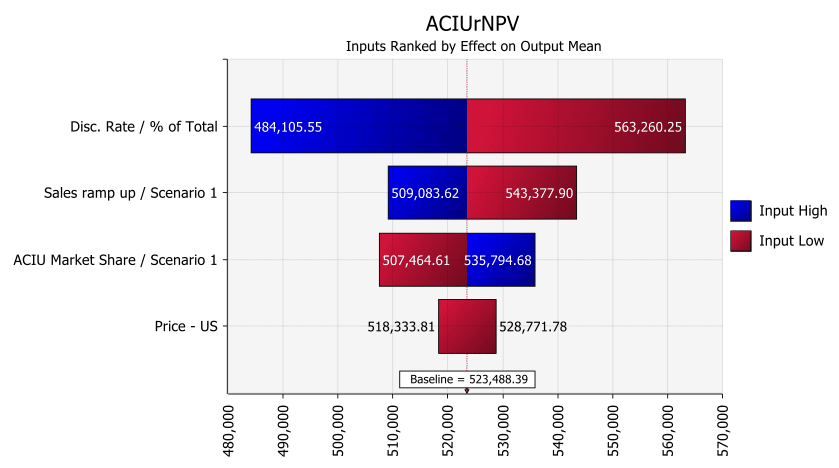
AC Immune also uses tornado charts to showcase the impact of certain assumptions on the resultant value, all other variables held constant. “The company can then decide how best to minimize the impact of certain factors via additional research into the assumption or other potential adjustments,” says Snow.
In addition to @RISK, AC Immune also uses PrecisionTree. “PrecisionTree allows us to set up dynamic decision trees linked to underlying cash flows to understand the risk/return at a specific point in time along the development timeline,” says Snow. “Additionally, it helps us weight a decision such as to partner or not partner a potential product candidate.”
Other decisions include the expansion of a program, addition of a second indication for research, or assistance in license and collaboration deal structuring. “Assessing the value of one decision or another is valuable for the company,” Snow says.
For AC Immune, our products significantly improve the quality of the decision-making process, particularly with regard to allocation of resources and improving understanding of the magnitude of uncertainty on key assumptions.
“@RISK software allows our company to sensitize key variables using various distribution methods, as well as convey the sensitivity in impact on the ultimate risk-adjusted net present value,” says Snow. “The software also conveys results in clear output graphics for easy reporting to relevant stakeholders.”
Prior to using our products, Snow and his team relied on Excel functionalities to calculate the relevant data. “We viewed this process as static and more cumbersome to maintain,” says Snow. “Therefore, with @RISK, AC Immune was able to enhance its internal valuation and reporting capabilities.”
According to Snow, other companies in this space do not typically leverage deterministic analysis to their valuation approaches. “Most peers use more static excel models that cannot capture or answer a more robust set of questions that arise over a long development timeline,” says Snow.
In addition, when comparing the cost-benefit of programs, assessing internal funding needs, assessing potential licensing and collaboration terms and other matters relevant to understanding the potential financial return from a product candidate, “AC Immune is able to ask and answer more questions than peers as a result of the use of the software,” Snow says.
Thanks to Lumivero's products, AC Immune has seen both tangible and intangible benefits, including:
Thanks to data-driven, deterministic analysis, AC Immune’s cutting-edge drug discovery technologies are better enabled to potentially help patients around the world.

Metaproject was asked by the Chilean government to advise on the best way to rescue the miners. Manuel Viera developed a new model in PrecisionTree to predict the best way to rescue the miners, calculating the method that would subject them to the least risk.
On August 5, 2010, a wall column in the San José mine in northern Chile collapsed, trapping 33 miners 700 meters underground. A second fall two days later, blocked access to the lower parts of the mine. The challenge was how to rescue the miners as quickly as possible, as well as ensure that their mental and physical health was maintained while the rescue mission was planned and implemented.
The rescue operation was very risky, not least because it was possible that another landslide could occur, with causal factors including geological faults, lack of accurate information from the plans of the inside of the mine, and insufficient knowledge about the structural geology of the mine. The additional drilling required to rescue the miners could have caused walls to collapse further as a result of micro fractures and faults in the rock.
As a result, it was initially believed that the operation to save the miners would be a very long process. The first estimates suggested that they would have to wait around five months to be brought back to the surface, although this was then revised to three or four months. However, 65 days after the first rockfall, one of the rescue drills broke through to the underground chamber, and the first miner was brought to the surface on October 13, 2010. The rescue operation was completed 22 hours later.
During the crisis, mining expert Manuel Viera, the CEO and managing partner of engineering consultancy Metaproject, was asked by the Chilean government to advise on the best way to rescue the miners. Mr. Viera developed a new model to predict the best way to rescue the miners. This calculated the method that would subject them to the least risk.
The magnitude of risk can be defined as a multiple of exposure, probability and severity, where:
Metaproject used Palisade’s decision tree analysis tool, PrecisionTree, to evaluate the various rescue alternatives from a technical and economical perspective. This enables an informed decision to be made with regard to selecting the option that is the least risky to the miners.
A key decision was whether to raise the miners to 300 meters below the surface, or to keep them in their current location near the refuge at 700 meters. There were also several drilling options for reaching the trapped miners:
A: Use of a Strata 950 probe to drill a ‘well’ 66 centimeters (cm) in diameter through which the miners could be lifted. The greatest risk was that the well would collapse when the cage containing the miners was raised to the surface. This rescue operation would take around three or four months, depending on the quality of rock, and other obstructions which were, at the time, unknown.
B: Because as many rescue alternatives as possible needed to be considered, the use of the larger Schramm T-130 drilling probe was also explored. This would enable a wider well (between 66cm to 80cm diameter) to be drilled. The risks were similar to those in A but, because the larger well meant that the rescue would be quicker and therefore reduce the exposure of the miners, the magnitude of risk was less. The timescale was similar.
C: Use of the proven DTH (Down The Hole) 26” probe or oil drilling RIG-421. Fast and powerful, this could potentially reduce the rescue time to one month, which would have decreased the miners’ exposure to risks.
D: A vertical tunnel to the miners could have been built. This would have required construction and was therefore more expensive and would take longer – however, it was an effective option. The key risks were ‘slabs’ (ventilation problems during the building process as the tunneling would have been carried out ‘blind’), general ventilation issues in the confined space, and the potential lack of patience of the miners.
E: An alternative (horizontal) tunnel could have been excavated from an already-drilled well under the collapsed site to reach the miners directly in the refuge. From here they could walk along the tunnel and be brought to the surface
The main issues and risks that had to be factored in to any calculation are as follows:
PrecisionTree presented a matrix of statistical results for each branch tree (i.e. rescue option). This made it is possible to ascertain, for example, that for some of the drilling options it was feasible to move the miners in two stages, but for others it was not, due to logistical problems.
The PrecisionTree analysis showed that the best option for rescuing the miners was to use the Schramm T-130 (Option B) followed by Option C, the DTH QL 200 (which was replaced by the drilling RIG-421). In addition, it was recommended that both options were used at the same time. Using two techniques would diminish the risk and increase the reliability of the rescue mission. The option of bringing the miners to 300 meters first was rejected.
Manuel Viera explains: “Palisade’s PrecisionTree is an excellent tool for modelling and conceptualizing real-life problems and analyzes alternatives that are technically feasible and economically viable in an Excel format. This can be applied to complex problems that have a big impact, and was therefore ideal for a major disaster such as the trapped miners.”
The actual rescue operation used three drills at the same time: Drill A, the Strata 950 raise bore machine; Drill B, the Schramm T-130 machine; and Drill C, the RIG 442 machine. As predicted by the Metaproject PrecisionTree analysis, Drill B was the first to reach the miners.
Asher Drory of the University of Toronto’s Rotman School of Management uses @RISK in his graduate-level Financial Management course.
Understanding how to use Monte Carlo simulation to account for risk in decision-making is quickly becoming a required skill for today’s business leaders, says Asher Drory, Adjunct Professor of Finance at University of Toronto’s Rotman School of Management.
“Many leading corporations are now using Monte Carlo simulation in their business cases,” Professor Drory says. “Students who want a leg up with such corporations should seek out all opportunities to get experience in working with Monte Carlo simulation.”
In his Financial Management course, Drory uses @RISK to teach some 200 graduate students each year how to use Monte Carlo simulation in analyzing working capital and capital budgeting decisions. Monte Carlo simulation furnishes the decision-maker with a range of possible outcomes and the probabilities that will occur for any choice of action.
For example, Drory’s classes use @RISK and Monte Carlo simulation to look at:
*How forecasts of financial statements are needed to determine future funding requirements in working capital decisions. *How forecasts of future free cash flows are required and risk must be assessed in capital budgeting analysis.
Separately, Drory and his students use Lumivero's (previously Palisade) PrecisionTree software in modeling decision tree analysis for new product development. The students have access to the entire DecisionTools Suite which is loaded on all of the computers in the Rotman Finance Laboratory.
“All key financial decisions such as investing, operating and financing decisions can benefit from Monte Carlo simulation,” says Prof. Drory, who has taught at the University of Toronto for 21 years. “I ran across @RISK about 5 years ago when I was looking for PC-based Monte Carlo simulation tools. @RISK has a straightforward and easy-to-use interface.”
Originally published: Dec. 17, 2021
Updated: June 7, 2024
A consultant with Triangle Economic Research, an Arcadis company, Tim Havranek works with Fortune 500 clients to identify and quantify their potential environmental liabilities and to simulate the least costly routes to meeting their responsibilities.
Large industrial companies operating out of many different locations and facilities often have numerous actual or potential environmental legacies that linger for decades as financial liabilities. Longtime DecisionTools® user Tim Havranek has made a successful career out of helping companies manage their “environmental risk portfolios” cost-effectively. A consultant with Triangle Economic Research, an Arcadis company, Havranek works with Fortune 500 clients to identify and quantify their potential environmental liabilities and to simulate the least costly routes to meeting their responsibilities. Many of the complex cases that he and his associates at TER work on involve hundreds of millions of dollars, multiple stakeholders, and a powerful amount of modeling. As he has for years, Havranek relies on @RISK and PrecisionTree® to compare the scenarios and the decision paths that guide his clients’ decisions.
In one recent case, a major industrial manufacturer sold approximately 15 of its active plants to another manufacturer. The terms of these sales included the provision that the original corporate owner would retain responsibility for historical environmental impacts. As time passed, environmental claims against the original corporate owner continued, and the corporation sought appropriate means of reducing cost and risks, such as receiving regulatory closure and/or selling the properties and liabilities to other parties.
Also, the historical environmental impacts at times potentially limited the ways that the new owners could manage and expand the properties. This often led to disagreements. Such disagreements were anticipated during the sale, and the purchase agreement included an arbitration clause to address issues as they arose.
The corporation identified three possible solutions:
Havranek used Triangle’s time-tested procedure for framing the model. He met with all the stakeholders to identify all known cost elements, inherent uncertainties, and future potential liabilities for each of the three alternatives. The model included more than 100 unknowns. In order to pinpoint those issues on which the company would need to prevail in arbitration, Havranek and his team performed sensitivity analyses on the cost drivers identified by the framing meeting participants. The model was then run using @RISK and PrecisionTree.
The model had three output cells, one for each alternative. The outcome was intriguing: the least costly alternative was to stay with the asset purchase agreement and arbitrate as needed. The model indicated an expected value savings of more than $30 million. An outside actuarial group verified and validated the model using proprietary actuarial software. In the end, the actuarial group’s projections agreed not only with Triangle’s inputs and assumptions but also with its findings.
Although other companies may turn to proprietary software to parse environmental risks, Havranek sees no reason to use custom software to accommodate the many complex inputs he includes in his models. He likes the convenience of working in Excel and being able to share his results with clients. But most important, he says, “I am always trying to streamline my models. To simplify simulations you need the flexibility that proprietary tools don’t always offer. These tools have that flexibility without any sacrifice of power. @RISK and PrecisionTree have all the power you need.”
U.S. Army Corps of Engineers (USACE) divisions use @RISK and the DecisionTools Suite for dam and levee safety, asset management, cost estimation, construction, SMART Planning, regulatory functions, program management, project management, and more.
The U.S. Army Corps of Engineers (USACE) is comprised of over 37,000 dedicated civilians and military personnel who deliver engineering services across 130 countries worldwide. With environmental stability as a guiding principle, the Corps is involved in projects as diverse as construction, natural resource management, energy and sustainability, capacity building, and more.
Many USACE division are already using @RISK and the DecisionTools Suite for engineering projects, including the Institute for Water Resources (IWR), the Hydrologic Engineering Center (HEC), the Risk Management Center (RMC), and USACE divisions in Buffalo, Great Lakes and Ohio River, Hanover, Huntington, Kansas City, Philadelphia, St. Louis, Sacramento, San Francisco, and Walla Walla. See the Greenup Locks and Dam case study for one example.
Several of the successful applications involve Lumivero Custom Development partnering with USACE engineers to build custom software solutions.
The U.S. Army Corp of Engineers turned to Lumivero Consulting to help incorporate an uncertainty element into dam and levee safety models. Lumivero consultants built a tailored @RISK-based application that determines the exposure of each project to loss of life, damage, and structure fragility. The Excel-based model uses @RISK’s Monte Carlo simulation to probabilistically assess potential risk areas.
With the safety models in place, USACE project leaders also wanted an efficient way to ensure all their engineers could implement Monte Carlo simulation into any new project analysis. Lumivero Custom Development added a tailor-made interface to the model, allowing engineers throughout the agency to quickly and easily create models, simulations, and reports in an automated, standardized manner. The solution is used today by USACE for all new dam and levee projects.
P&G trained over a thousand people throughout the company on @RISK for modeling its entire range of investment decisions including new products, geographical expansions, manufacturing projects, and production siting.
“We’ve trained well over a thousand people throughout the company on @RISK,” says Procter & Gamble’s Bob Hunt, and now he’s rolling out another Decision Tool, PrecisionTree. In fact, Hunt, who is Associate Director for Investment Analysis in P&G’s Corporate Finance organization, and serves as a resource to the business units, was on his way to China and Japan to introduce PrecisionTree to P&G Finance managers in those countries.
P&G has been using @RISK since 1993 when Hunt first introduced it for modeling production siting decisions. The company was evaluating some cross-border siting options, and these decisions required them to take into account not only uncertainties involving the capital and cost aspects of plant location but fluctuations in exchange rates as well. The company has since come to rely on @RISK for its “entire range of investment decisions” including new products, extensions of product lines, geographical expansions into new countries, manufacturing savings projects, and production siting.
More recently Hunt and his colleagues have been working with PrecisionTree. “Its attraction is its capacity to value complex decisions, which often involve multiple, sequential decision steps”. They find it particularly valuable in evaluating “real options”. “We considered using financial option calculators to analyze the real options that are embedded in our complex decisions, but we found that they simply can’t solve for the real option value in projects with multiple, sequential investment decisions. Decision trees are really the only tool that can correctly value multiple sequential decisions where uncertainty is private risk.” Last spring, Hunt taught three (3) business units how to use PrecisionTree to test it as a tool for valuing complex decisions made under uncertainty. After a successful test, Procter & Gamble is now in the process of rolling out PrecisionTree to all of its major business units around the world.
Business units are evaluating investment options based on their impact on shareholder value, and PrecisionTree helps them make good choices and better decisions. “It has been very useful in helping us break complex projects down into individual decision options, helping us understand the uncertainties, and ultimately helping us make superior decisions.” He also notes that a lot of the value derived from using PrecisionTree is realized during the process that the staff goes through in determining the probabilities, and laying out the decision sequence and the criteria for making those decisions. The combination of the different approach required to frame decisions, and the ease and effectiveness of the PrecisionTree software, says Hunt, “is really powerful for our company.”
In an award-winning case study, researchers at the London Business School used @RISK, PrecisionTree, and RISKOptimizer to demonstrate some of the analytical techniques used by Novartis for R&D project selection and prioritization.
R&D project selection and prioritization problems are a recurrent issue of strategic importance for Novartis. In the pharmaceutical industry, project portfolio decisions are crucial to the viability and success of a company, and require huge investment commitments. The case study developed by the LBS researchers illustrates the usefulness of management science methods for this purpose. In particular, decision analysis, simulation and optimization are used to analyze and optimize project portfolio decisions. This is relevant in today’s pharmaceutical industry, as it is facing an increasingly tough environment and needs to improve the quality of decision-making in order to maintain profitability.
The London Business School case starts with an overview of the pharmaceutical industry and the challenges in the drug development process, including the massive required R&D investments, possibility of failure, and commercial uncertainty. Subsequently, the case discusses the work performed by the project portfolio group at Novartis. In other pharma companies, this group is sometimes referred to as the “project management group” or the “decision analysis group.” They collect the project data and requirements submitted by the individual therapy areas and collate them to analyze the global company portfolio. The case reports Novartis’s decision process, focusing on the role of the Innovation Management Board (IMB), which takes the portfolio decisions at Novartis Pharma. It also presents an extensive discussion of the issues in project portfolio management.
The London Business School case study won the 2004 INFORMS Case Competition, a prestigious competition for the best case study in Operations Research/Management Science, organized by the Institute for Operations Research and Management Science.
To better inform decisions, Unilever selected Lumivero’s DecisionTools Suite as the principle analysis software to support its Decision Making Under Uncertainty process and decision-focused culture due to its flexibility and ability to do Monte Carlo and decision tree analysis.
In recognition that the decisions it needs to make around business-critical innovation are highly complex, global fast moving consumer goods supplier Unilever developed its Decision-Making Under Uncertainty (DMUU) approach. Combining a structured method with Lumivero’s DecisionTools Suite software ensures that project teams fully understand the scope of their decisions, and have the tools and the knowledge to make informed and high-quality choices. This prevents opportunities and threats being overlooked, and increases Unilever’s agility in the market place.
Unilever is one of the world’s largest suppliers of fast moving consumer goods in the refreshment, foods, home and personal care sectors. With a portfolio of over 400 brands, it has consistently ambitious growth targets. The company has an extensive annual budget for cutting-edge research and development, and thousands of projects in its innovation pipeline at any one time. This means that in order to make informed decisions on how to manage this portfolio, it needs absolute clarity around the risks and opportunities it faces.
However, like any large, dynamic organization, complexity has a large impact on Unilever’s decision-making process. Many parties are involved in the process, often with conflicting values, motivations, perspectives, personalities and power bases. These organizational complexities are reinforced with analytical complexities such as the large number of interrelated inputs that must be factored in to the decision, the high level of uncertainty inherent in early-stage developments and potentially conflicting decision criteria.
For business-critical innovation, Unilever recognized the inherent complexity of its decisions and the need to maintain a dual internal and external focus to prevent important opportunities and threats from being overlooked. It understood that incorporating these factors into an effective decision making process would improve decision quality, facilitate faster decision making and ultimately increase Unilever’s agility in the market place.
The Unilever response was to develop a unique approach known as Decision Making Under Uncertainty (DMUU). This is a disciplined, methodical and structured approach to decision-making, with probabilistic analysis at the heart of its logical reasoning. It combines framing and structuring tools with leading-edge analytical software – Lumivero’s DecisionTools Suite. The DecisionTools Suite is an integrated package of seven risk, decision, and data analysis tools that run in Microsoft Excel. This approach ensures that project teams fully understand the scope of the decision, that they have the tools and the knowledge to make high-quality decisions, and the insight to understand the consequences of taking one course of action over another.
Overall, DMUU helps to provide the required clarity, insights and commitment to action.
Unilever selected Lumivero’s DecisionTools Suite as the principle analysis software to support its DMUU process and decision-focused culture due to its flexibility and ability to do Monte Carlo and decision tree analysis using component products @RISK and PrecisionTree, respectively. Today, the DecisionTools Suite enables Unilever to develop probabilistic business cases for its biggest innovations, as well as its major strategic decisions.
DMUU and the use of the DecisionTools Suite is now a standard part of Unilever’s innovation process and probabilistic business cases are required for all big and complex projects. For example, a typical use for @RISK, the risk analysis element of the suite, is in evaluating alternative strategies for a new product launch or a major capital investment.
Unilever teams also use PrecisionTree, the decision analysis tool, to evaluate early stage projects where decisions and uncertainties will occur at various times in the future. This approach, using decision trees in PrecisionTree, is used to evaluate the current value of a project and also to understand the risks and benefits of internal versus external development routes.
In recognition of the importance of the DMUU, Unilever has an internal consultancy function to provide decision support and software expertise when required.
In addition, Lumivero’s software is used to support other business areas including supply chain, safety, regulatory, as well as additional complex one-off decisions. All of these have the common features of multiple compelling alternatives, significant contradictions on how to proceed and high stakes should the ‘wrong’ decision be made.
“Strategic decisions require a process that addresses all the elements of decision quality,” explains Andrew Evans, decision analyst at Unilever. “However, an integral part of that process is powerful and flexible software that informs the debate on which direction should be taken. We evaluated various options and Lumivero’s DecisionTools Suite was the tool that best met our business requirements. As a result it has played a key role in increasing the quality of decision-making and helping project teams to think clearly, act decisively and feel confident.”
Key software / features useful to Unilever: @RISK is the most commonly used application of the tools available in the DecisionTools Suite. Decision-makers at Unilever are now used to seeing insights from business cases described using histograms and advanced sensitivity tornados. Box-and-whisker diagrams (box plots) are also very useful when alternatives or projects need to be compared. Sensitivity and scenario analysis are used to understand the key drivers of uncertainty. In addition, analysts help to draw insights from the models using summary graphs and scenario analyses to inform decisions.
Pert and Triang are the distributions used most often when Unilever is deploying @RISK to evaluate business cases, as they are good for describing distributions when data is elicited from experts. The discrete distribution is used to simulate alternative futures, such as competitor action, or different levels of success in a product launch. However, when good quality historic data is available, or when the ‘tails’ (eg in safety studies) are of interest, Unilever uses the wider set of distributions and tools such as distribution fitting feature available within @RISK.
Learn how you can make informed decisions by requesting a free 15-day trial of @RISK and DecisionTools Suite.