Measuring supply chain performance seems straightforward—pick some KPIs, track them, and see how you’re doing. But here’s the catch: the right metrics depend entirely on your strategy. A lean supply chain focused on cost efficiency needs a very different scorecard than an agile one built for speed and flexibility.
That’s the question the research team for “Evaluating Performance Measurement Metrics for Lean and Agile Supply Chain Strategies in Large Enterprises” set out to test: what are the most relevant supply chain performance metrics for each supply chain strategy?
To get answers, they gathered performance data from 45 large enterprises and used XLSTAT’s Partial Least Squares–Path Modeling to map the links between supply chain strategies and the metrics that best track them. This study offers a framework for aligning KPIs with organizational strategy, grounded in robust empirical evidence.
In this article, we’ll unpack what the researchers found—and how XLSTAT, a leading statistical analysis software, helped turn complex survey data into clear, actionable insights.
Research framework and methodology
The researchers grounded their approach in contingency theory—the principle that the effectiveness of a performance measure depends on its fit with the strategy being followed. They began by categorizing KPIs into two main groups:
- Financial and efficiency metrics (such as cost per unit, productivity rates, and inventory turnover).
- Customer service and flexibility metrics (such as order lead time and on-time delivery).
They surveyed 45 large enterprises, gathering data on both their supply chain strategies and the performance measures in use. To analyze the results, they applied Partial Least Squares–Path Modeling (PLS-PM) using the XLSTAT software add-on for Microsoft Excel, which allowed them to model complex relationships between strategies and metric groups.
Key findings from the analysis
The findings showed that financial and efficiency metrics align more closely with the lean supply chain strategy, while customer service and flexibility metrics are better suited to the agile supply chain strategy.
These results confirm the core theory underpinning this research, namely performance effectiveness stems from the strategy pursued. For managers, this validation is crucial, as it provides solid scientific support to justify the revision or redesign of indicators to stakeholders, thereby strengthening the legitimacy and impact of their decisions.
Implications for supply chain strategy
Misaligned metrics can quietly undermine even the best strategies. A lean-focused supply chain that’s tracking agility-oriented indicators might waste resources chasing goals that don’t actually drive its success. An agile operation overemphasizing unit costs may slow its own responsiveness, undercutting its competitive edge.
This study offers a practical roadmap for cutting away irrelevant measures and zeroing in on what supports the chosen strategy. That clarity has ripple effects: investment decisions become more strategic, performance reviews more meaningful, and operational changes more targeted. The result is a performance measurement culture where metrics aren’t just numbers on a dashboard—they’re drivers of strategic alignment.
Behind the scenes: XLSTAT in action
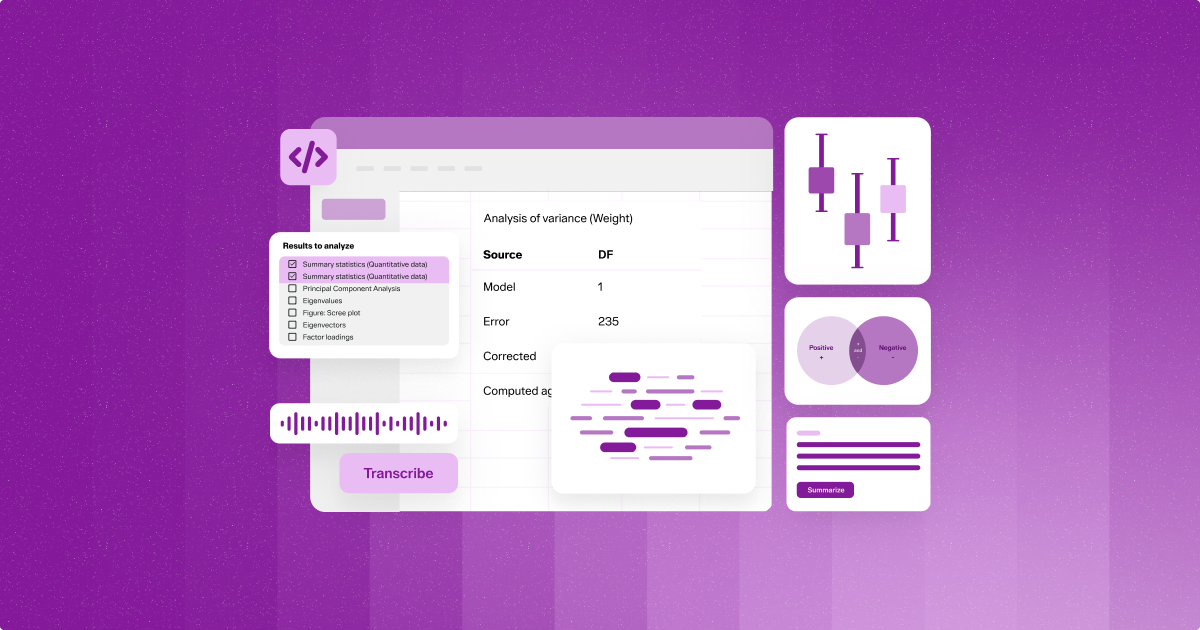
A key part of the study’s strength lies in the tools used to analyze the data. XLSTAT made it possible to run advanced statistical modeling without leaving Excel. For the researchers, that meant managing survey data, building PLS-PM models, and visualizing the results all in one familiar environment.
PLS-PM is particularly well-suited for this kind of work because it can handle complex relationships between latent variables—like strategic orientation and KPI clusters—while accommodating smaller sample sizes.
By making advanced statistical modeling accessible within Excel, XLSTAT bridges the gap between academic rigor and practical usability. Practitioners can now generate robust, data-driven insights without mastering specialized programming environments, enabling faster, more informed decisions and expanding the reach of sophisticated analysis beyond traditional data specialists.
Turn your data into decisions with XLSTAT
Whether you're exploring trends, uncovering patterns, or testing hypotheses, XLSTAT brings advanced statistical power straight into Excel—without needing any coding expertise.
Whether you’re a researcher, analyst, educator, or data-driven decision-maker, XLSTAT gives you the tools to explore, model, visualize, and communicate results with speed and confidence.
Take your data further. Buy XLSTAT today and turn complex datasets into clear decisions.