Turn uncertainty into confident decisions


See every possible outcome with Monte Carlo simulation that exposes risks and opportunities before they impact your plans.
Expand from project models to enterprise programs, integrating risk management tools for full control and visibility.
Transform complex analysis into stakeholder-ready reports and visualizations that drive alignment and decisive action.
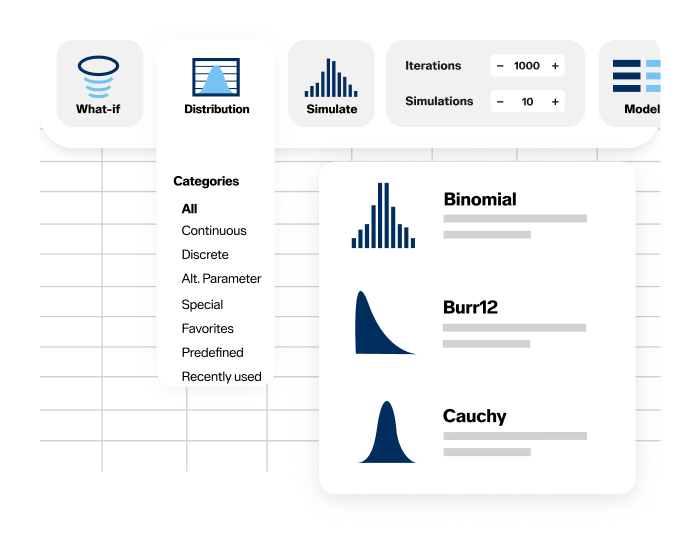
Build risk scenarios directly in Excel using 90+ probability distributions. Test assumptions with scenario analysis, explore multiple outcomes, and connect with Predict! for enterprise-wide risk registers while modeling in familiar spreadsheets.

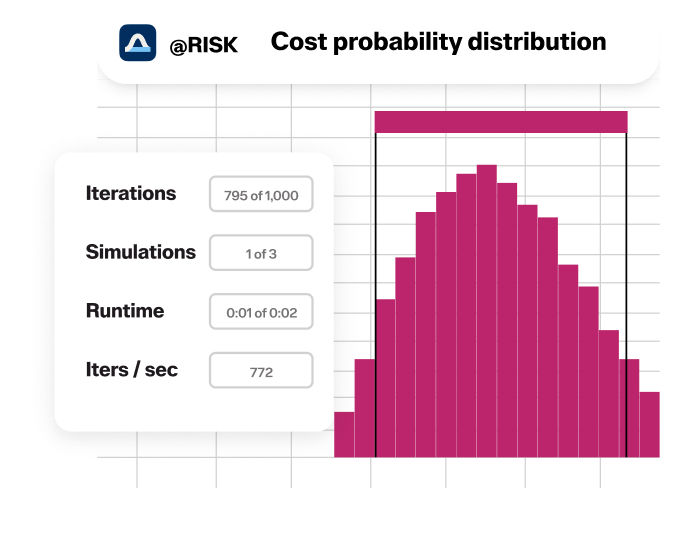
@RISK runs thousands of Monte Carlo simulations automatically, testing every scenario within your defined probability ranges. Quantify risks across projects and portfolios, identify critical risk drivers, and understand the full spectrum of potential outcomes.


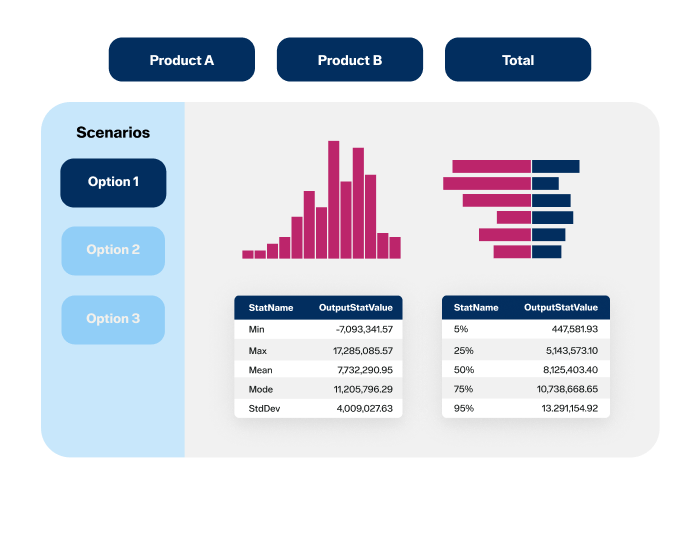
Identify key risk drivers using tornado diagrams, distribution charts, and sensitivity analysis. Share results from Excel into Predict! for centralized risk management, and bring insights into SharpCloud to visualize dependencies, assess decision impacts, and align stakeholders.

Quantify cost, schedule, and reliability risks for mission-critical programs.

Improve estimates, prevent overruns, and strengthen project contingency plans.

Forecast uncertainties, stress-test decisions, and strengthen long-term resilience.

Assess portfolio risk, model returns, and guide capital allocation strategies.

Evaluate exposure, price accurately, and prepare for low-probability events.

Optimize operations, predict demand, and evaluate supply chain vulnerabilities.

| Feature | Benefit | Professional Edition | Industrial Edition |
|---|---|---|---|
| Monte Carlo simulation | Shows possible outcomes to avoid pitfalls and identify opportunities |  | |
| 100% Excel calculations for simulation | Highest level of accuracy, and maximum use of multi-core processors for speed | | |
| Feature | Benefit | Professional Edition | Industrial Edition |
|---|---|---|---|
| Seamless Integration into Microsoft Excel | Never leave your spreadsheet; get up to speed quickly | | |
| Intuitive toolbars and right-click menus | Easy navigation—multiple ways to perform common tasks | | |
| Feature | Benefit | Professional Edition | Industrial Edition |
|---|---|---|---|
| Distribution Palette and Insert Function command | Easy and accurate definition of uncertain factors | | |
| Distribution Fitting and Distribution Artist | Use data and expert judgment to define uncertain factors | | |
| Over 90 built-in distribution functions | Represent virtually any uncertain factor for accurate modeling | | |
| @RISK Function Swap | Remove (and later restore) @RISK functions for sharing models with non-@RISK users | | |
| Predefined Distributions | Create customized distributions with your own parameters and names | | |
| Compound function | Combines two distributions into one, to streamline insurance or other large models | | |
| Percentile distribution parameters | More flexible ways to define uncertainty | | |
| Correlation and Copulas | Standard correlation available, along with copulas, which provide sophisticated methods for correlating uncertain @RISK variables that allow more control over the correlation pattern | | |
| @RISK Data Viewer | Display any spreadsheet data using all @RISK charts and graphing options | | |
| Excel Developer Kit (XDK) | Automate and customize @RISK for Excel through a library of commands and functions that let you control every aspect of @RISK in your spreadsheet | | |
| Feature | Benefit | Professional Edition | Industrial Edition |
|---|---|---|---|
| Demo Mode and live updating | Graphs and reports update during simulation for illustration to others | | |
| Extensive settings control | Customize simulations to specific needs | | |
| Feature | Benefit | Professional Edition | Industrial Edition |
|---|---|---|---|
| Fully customizable, presentation-quality graphs | See the impact of risk and communicate to stakeholders | | |
| Reporting in Office | All graphs and charts can be exported to Excel, Word, and PowerPoint in native chart format for easy distribution to others | | |
| Customized Excel Reports | Create exactly the simulation results reports you want directly in Excel, automatically formatted for optimal viewing. Apply Excel themes to your graphs. | | |
| Histograms, area, line, cumulative, summary, box plot, and overlay graphs | Variety of graphing and charting options for easy, accurate communication | | |
| Tornado charts and scatter plots | Visually identify critical factors and trends, overall and for particular scenarios | | |
| Sensitivity and Scenario Analysis | Identify the individual tasks that have the most impact on results, and the particular scenarios that lead to certain results | | |
| Six Sigma functions | Report Six Sigma statistics for quality analysis | | |
| Stress Analysis | Lets you control the range that is sampled from a distribution function, enabling you to see how different scenarios affect your bottom line without changing your model | | |
| Advanced Sensitivity Analysis | Lets you see how changes in any input—distributions or regular values—affect simulation results | | |
| @RISK Goal Seek | Uses multiple simulations to find an input value that achieves a target simulation result you specify | | |
| Feature | Benefit | Professional Edition | Industrial Edition |
|---|---|---|---|
| Simulation of Time-series forecasts | Understand the risks in values that change over time |  | |
| Correlation of Time Series | It is possible to correlate two or more time-series functions so that during each iteration the array of values returned by the individual time series are subject to the specified correlation coefficient. | | |
| Multi-core processor and multiple CPU support | Speed up simulations. “Split up” large simulations to run on multiple CPUs or cores and reduce simulation run time. | | |
| RISKOptimizer | Solve problems with more accuracy than ever. | | |
| Feature | Benefit | Professional Edition | Industrial Edition |
|---|---|---|---|
| Optimization under uncertainty | Combines Monte Carlo simulation with sophisticated optimization techniques to find optimal solutions to uncertain problems. Used for budgeting, allocation, scheduling, and more. | | |
| Efficient Frontier Analysis | Especially useful in financial analysis, Efficient Frontiers determine the optimal return that can be expected from a portfolio at a given level of risk | | |
| Ranges for adjustable cells and constraints | Streamlined model setup and editing | | |
| Genetic algorithms | Find the best global solution while avoiding getting caught in local, “hill-climbing” solutions | | |
| Six solving methods, including GAs and OptQuest | Always have the best method for different types of problems | | |
| RISKOptimizer Watcher and Convergence Monitoring | Monitor progress toward best solutions in real time | | |
| Overlay of Optimized vs Original Distribution | Compare original output to optimized result to visually see improvements | | |
| Original, Best, Last model updating | Instantly see the effects of three solutions on your entire model | | |
Real-world applications and educational resources for @RISK and risk management
 Global State of Risk Report
 The Essential Guide to Decision-Making in Capital Projects
 Using Monte Carlo Simulation in Excel to Understand Possible Outcomes
Risk analysis software helps organizations identify, quantify, and manage uncertainty in business or project decisions. It uses methods like Monte Carlo simulation, sensitivity analysis, and scenario modeling to forecast outcomes, assess risk exposure, and support more confident, data-driven decision-making.
@RISK is Lumivero’s leading Excel add-in for risk analysis using Monte Carlo simulation. It computes and tracks many different possible future scenarios and shows you the probability of each occurring. @RISK’s analytics guide your decision-making process to achieve the optimal outcome.
With advanced features like Monte Carlo simulation that calculates all possible outcomes of scenarios and presentation-ready reports, you can use @RISK to:
If you need to make smart, strategic decisions in the face of uncertainty, @RISK is right for you.
Organizations across all industries are being asked to reduce risk while increasing margins and finding new opportunities for business growth. With @RISK, companies can navigate these evolving expectations and make strategic decisions with confidence.
Industries using @RISK include:
Roles that benefit from @RISK include: Risk Analysts, Project Analysts, Portfolio Managers, Financial Analysts, Engineers, Operations Managers, Strategic Planners, and Decision Scientists.
@RISK brings Monte Carlo simulation into Excel with a user-friendly interface. It repeatedly samples values from your input distributions and recalculates outputs thousands of times, generating a full range of possible scenarios and their probabilities. This shows not just what could happen, but how likely each outcome is.
@RISK lets you define uncertain inputs as probability distributions, select outputs to analyze, and then run the simulation directly from the @RISK ribbon. The software automatically generates thousands of scenarios along with probability charts, sensitivity analyses, and clear reports—directly in Excel.
@RISK combines Excel-native ease of use with advanced Monte Carlo simulation, probability distributions, and powerful scenario analysis. With 35+ years of proven reliability, it also integrates with Predict!, turning spreadsheet simulations into governed risk processes with portfolio-level visibility across projects and programs.
If you have a current maintenance contract, you’re eligible for a free upgrade to the latest release. Learn more about what’s new in the latest release and instructions for upgrading in the @RISK Knowledge Base.
@RISK and the DecisionTools Suite are only compatible in a Windows environment.
Monte Carlo simulation is a method for modeling uncertainty. Instead of fixed values, you assign probability distributions to inputs. The model is recalculated thousands of times, producing a full range of possible outcomes and their likelihoods—helping you understand risks and make more confident decisions.
There are several stages of learning all things @RISK. If you are new to the concepts of risk analysis with Monte Carlo simulation, the Getting Started Guide is a great start. If you understand quantitative risk analysis but need help with @RISK, in addition to this guide there are files available in Examples menu on the ribbon.
Contact our experts to see how @RISK helps you make smarter decisions and quantify uncertainty with confidence.
Trusted by 93% of the Fortune 100 for over 35 years.