Lumivero’s PrecisionTree software allows you to analyze the probabilities of different outcomes, and their impacts, in sequential, multi-stage decisions. The decision trees in PrecisionTree show the probabilities of these outcomes assuming that the optimal decisions are made at each of the decision nodes (points in the process where a decision needs to be made) in the tree. “Optimal” is defined by the software as the path ultimately leading to the greatest or least (as defined by the user) payoff of the entire process. But analyzing the suboptimal decisions with PrecisionTree can also lead to valuable insights.
Consider a situation that is directly relevant to the supply chain issues that continue to impede the global economy: a manufacturer weighing different purchasing strategies for a raw material commodity such as lumber, oil, or sugar. The manufacturer has three options:
The decision tree mapping out this problem calculates the possible payoffs of each purchasing strategy, based on the uncertain movement of the commodity’s price in six months. Here is an example of what this decision looks like, considering the possibilities of the price going up a lot, going up a little, staying the same, going down a little, or going down a lot:
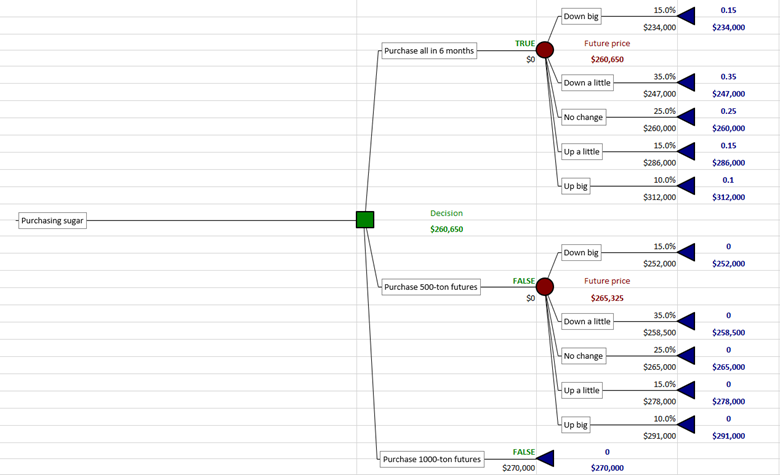
Purchasing strategy decision in PrecisionTree
You can run a decision analysis in PrecisionTree to obtain a risk profile chart that displays the payoffs of each possible decision outcome for each of the three purchasing strategy choices, and the probabilities each will occur:

Risk profile data showing probabilities and payoffs of each decision outcome for each purchasing strategy choice.
We can multiply each “Value” and its “Probability” to get what you could call “Expected Value Components.” These are the probability-adjusted values of each decision outcome payoff. Adding the Expected Value Components in each column with get us the expected value of each given choice. Here is the same chart with these expected values calculated:
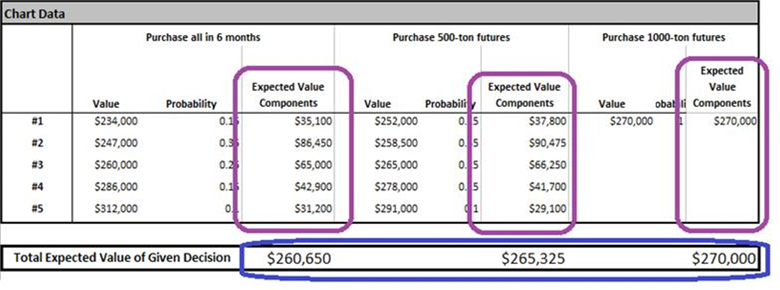
Risk profile data showing expected values of the payoffs of each decision outcome.
You can check the accuracy of this analysis by comparing the circled total expected values of each choice against the same values displayed in the original decision tree:
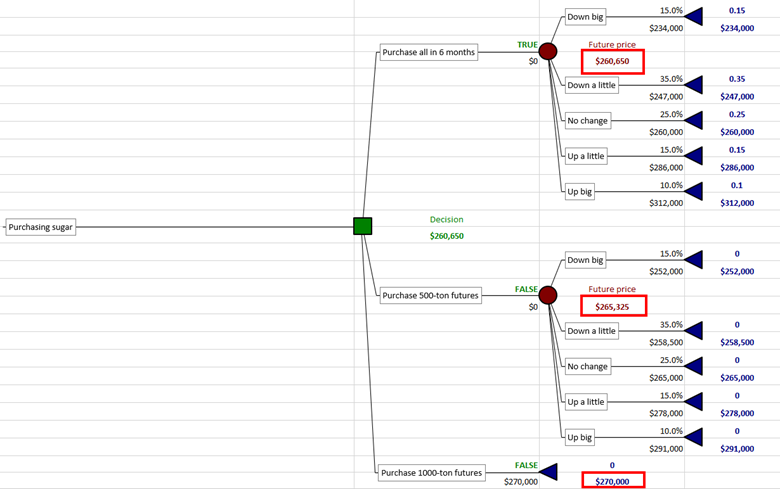
Expected values of the payoffs of each choice in the decision tree.
So we don’t need these manual steps to get the expected value for each choice; the numbers are there in the tree to begin with. But we needed to perform these steps to get the intermediate Expected Values Components of each possible decision outcome. (Code could be written to perform these manual steps automatically, using VBA and the Excel programming interface of PrecisionTree, called the PrecisionTree XDK.)
But why do this? Why does the probability-adjusted payoff value of each possible outcome from each strategy choice matter? As noted earlier, PrecisionTree interprets “optimal” as maximizing or minimizing expected value of the entire tree. But we don’t necessarily always want to do that. You may want to see the expected values of each individual outcome to make the best decision for you, based on your own preferences, even if it's considered a suboptimal decision. Consider a bet that pays $1 million + $1 ($1,000,001) if a coin flip comes up heads, and loses exactly $1 million if it comes up tails. Here is what a comparison of the expected values of each choice looks like:

Strictly speaking, the optimal decision would be the one that maximizes expected payoff, so you should take the bet. However, not everyone would be comfortable with a 50% chance of having to pay $1 million. PrecisionTree’s Risk Profile report allows you to look at the possible consequences of each choice and their probabilities, before they get merged into a single “expected value.” This allows you to compare the worst case scenarios for each choice and their probabilities, and make a more informed decision based on your risk tolerance and personal preferences.
You can also modify a decision tree in PrecisionTree to force it to take a suboptimal decision. The forced decision then shows up as red in the tree model, and the overall value of the decision is recalculated accordingly:
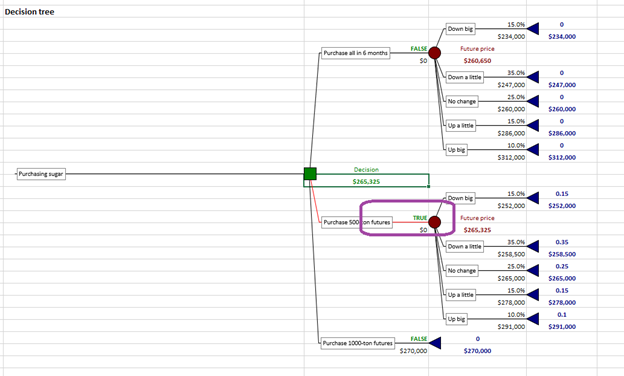
A forced decision in PrecisionTree.
Download a Copy of this Example Model >>
See how you can use PrecisionTree to analyze suboptimal decisions with a free 15-day trial of DecisionTools Suite.

In our first post, we discussed how presenting objective, realistic models that show all possible scenarios helps manage expectations early in the litigation process, setting the stage for productive settlement discussions. In this post, we will be delving into why patent litigation is a particularly expensive process and walk through an example of a litigation decision tree.
On average, it takes 2.4 years for patent cases to complete the full litigation process and only 2-5% of patent cases reach the pre-trail and trial phase, according to James C. Yoon, partner at Wilson Sonsini Goodrich & Rosati. This drawn-out process leads to the accumulation of significant legal expenses.
Yoon noted that the total cost of patent litigation depends on the potential range of damages. For cases that go through trial, those with less than $25 million “at risk” total $2.6 million in expenses and cases with more than $25 million “at risk” amount to $5.5 million in expenses.
As covered in our previous legal blog series (download here), the dynamic nature of patent litigation and the potential for significant financial loss are two main reasons why firms often get entangled in lengthy negotiations.
To lay the groundwork for swift settlements, many legal firms use PrecisionTree software to map out all possible routes a litigation path can take by building quantitative, probabilistic decision trees that calculate case outcomes along the way. This decision-making software can calculate for risks and rewards, forecast case budgets, identify key investigation areas, and create impartial, realistic models to cut down on time and costs.
Since PrecisionTree works within Microsoft Excel, it allows for great flexibility in defining decision model nodes and functions and may be added to any cell in your existing spreadsheets. Furthermore, PrecisionTree is designed to work with Lumivero's @RISK software, allowing for the creation of the most accurate decision tree models anywhere.
Dive deeper into litigation decision trees with the example below.
Litigation Decision Tree Example
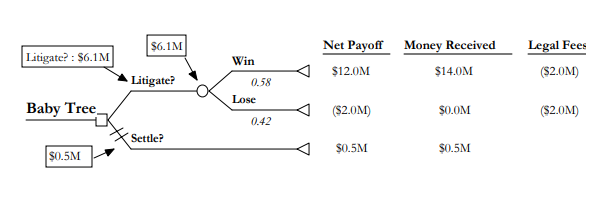
Figure titled “Baby Tree” from previous legal blog series, The Economics of Litigation.
A decision tree, like the example “Baby Tree” above, is read from left to right with each new decision or event occurring at the square decision node. For this litigation decision tree, the two options are to litigate or settle.
To the right of the Litigate decision branch, you have a chance node represented by a circle. Chance nodes represent uncertainties which are assigned probabilities of an event occurring. In this figure based on case win rate data, there is a 58% chance of winning and 42% chance of losing the case. These probabilities are represented under the Win and Lose decision branches. All paths through the decision tree conclude with a final outcome, represented here with the triangle. The final outcome for litigating in this figure is a $14 million judgement and was based on past average award data. This is shown in the Money Received column to the right of the figure.
We know that the settlement offer was $500,000 which is shown in the box by the Settle decision branch. To determine the expected value of litigating, we work backwards from the $14 million judgement. First, we’ll calculate net payoff by subtracting the $2 million in legal fees from the money received for winning and losing the case. Then we’ll multiply net payoff for winning by the probability winning the case ($12 million x .58 = $6,960,000) and do the same for the Lose decision branch (($2 million) x .42 = (840,000)). We add these together to find the expected value of litigating which is $6.1 million. Since the result of $6.1 million is greater than the settlement value, the plaintiff should choose to continue litigating.
As shown in this basic example, the first goals when creating a decision tree should be to show the major choices, potential following event, probabilities these events could occur, and the result of the events.
In the next series post, we’ll discuss common decision analysis challenges and explore how Lumivero's @RISK software helps determine fair market value of intellectual property.
At Lumivero, we provide cost-effective, easy-to-use analytics to companies who want to make better decisions. To learn more about how we can help you speed up negotiations, determine fair market value of IP, or even solve a different challenge you might be facing, check out the previous series post or request a free trial of @RISK and PrecisionTree, included in the DecisionTools Suite.