According to Wikipedia, data analysis is “the process of inspecting, cleansing, transforming, and modeling data with the goal of discovering useful information, informing conclusions, and supporting decision-making.” There are many other definitions, of course, but the decision support aspect of this description is particularly important. There’s no disputing that data analysis is about better understanding data to identify patterns or insights. But what good are those conclusions if not for the purpose of making better decisions going forward?
Data analysis is applied within a wide range of fields – from industry to science to public policy – and to many different types of decisions including demand forecasting, quality and reliability analysis, investment planning, banking and credit, healthcare, and mineral exploration. The goal of data analysis is to provide decision-makers with an objective, defensible, quantifiable basis for future predictions and decisions.
There are almost as many methods for performing data analysis as there are data analysts, and they range from qualitative data analysis (focusing on questionnaires, attitudes, etc.), to text analysis (focusing on machine-readable text information), to statistical and predictive techniques. We will focus on two of the most common forms of data analysis, statistics and neural networks.
Statistical analysis is simply the application of mathematical concepts to data to discover patterns and trends. Statistics are meant to remove bias from decision-making, and (resources permitting), analyses can examine every data point in a population. In general, statistical analysis involves a process beginning with understanding the data at hand and ending with a descriptive or predictive model. One summary of these steps comes from Business News Daily and is as follows:
There are different types of statistical analysis, employing different mathematical techniques to achieve different goals. Some of the more common types include:
Forecasting is particularly useful for describing and predicting cyclical or repeatable trends, such as retail sales. Forecasting analyses can account for seasonality in data and can be adjusted to intelligently eliminate outlier or “one-off” occurrences to maintain the integrity of future predictions. Once a forecast model is built, no additional data is needed to make a forecast, though the confidence of the forecast wanes the further in the future you go.
Robust statistical analysis tools are available for decision-makers right where they work most with data — in their spreadsheets. This provides maximum modeling flexibility with a minimal learning curve.
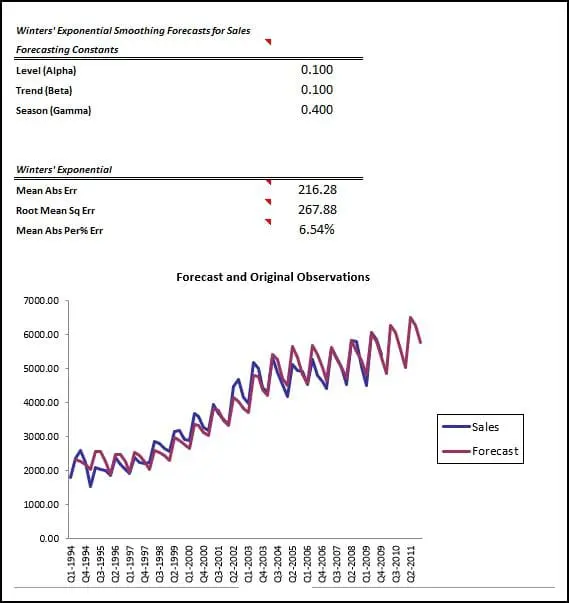
A statistical forecast.
Neural networks are a form of machine learning in which an algorithm that mimics the human brain “learns” how to make a prediction or infer an unknown characteristic by analyzing and training itself using existing data.
In this sense, neural networks refer to systems of artificial “neurons,” or mathematical functions. Desired outputs could be predictive, such as the likelihood a new borrower will repay a loan, or inferential, such as the most likely classification for an unknown brain tumor. Neural networks can adapt to changing input data, enabling the network to generate the best possible result without needing to redefine the output criteria. It is a technique that is gaining popularity in fields such as
Powerful neural networks are available for decision-makers right where they work most with data — in their spreadsheets. This provides maximum modeling flexibility with a minimal learning curve.

After training, a neural network tests the accuracy of its algorithm.
Lumivero’s StatTools and NeuralTools software put powerful data analysis at the fingertips of any Excel user. StatTools makes it easy to analyze, predict, and visualize information, and NeuralTools enables decision-makers to develop accurate predictive models with a few clicks.
Both products are available in the DecisionTools Suite. These combined analyses allow the creation of the most accurate decision analysis models anywhere, while maintaining point-and-click ease-of-use.