Risk & Decision


Research & QDA


Field Placement & Assessment


Resources


LEARN
Blogs
Explore insights, tips, and industry trends
Case studies
See how organizations achieve real results
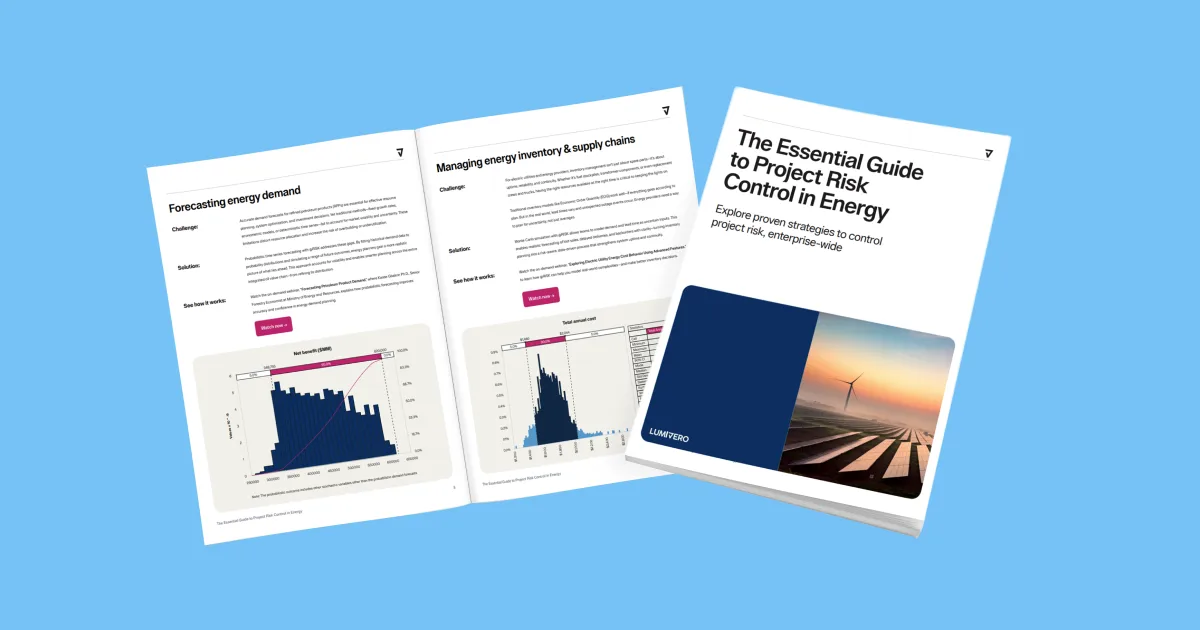
eBooks and reports
Access in-depth research and expert analysis
Webinars
Join live and on-demand sessions with experts
Whitepapers
Access research and expert analysis