Researchers used @RISK and PrecisionTree to model the likelihood of a successful evacuation during a volcano eruption.
University of Bristol’s Environmental Risk Research Centre (BRISK) adds new dimension to modeling volcanic risk in Guatemala.
Conducting a quantitative risk assessment is often a difficult process, requiring data that is sparse or even unobtainable. With volcanoes, the effects of uncertainty are accentuated by the potentially high costs of making a wrong call.
Guatemala has many active volcanoes, but none are as close to large populations as the ‘Volcán de Fuego’, potentially one of the most dangerous volcanoes in Central America with a large population surrounding it. Many farmers live and work in its shadow due to the fertile slopes that provide the best ground for coffee growing in the region. Large eruptions in 1974 fortuitously did not lead to any deaths, but buried in the volcano’s geological history are signs of ominous behavior.
The volcano has been very active over the last few years with many small eruptions taking place every day, and the fear that this activity could suggest the build up towards larger eruptions in the future is a worrying prospect. The “Instituto Nacional de Sismologia, Vulcanologia, Meteorologia e Hidrologia” (INSIVUMEH), regularly monitors activity at the volcano, however, despite the gallant efforts of the scientists there, no formalized risk assessments are carried out, mostly due to lack of funding and resources.
Recent work using Lumivero's (previously Palisade) The DecisionTools Suite however, is now enabling volcanologists to quantify the nature of one of the threats from the volcano to peoples’ lives. As an integrated set of programs for risk analysis and decision making under uncertainty, The DecisionTools Suite running in Microsoft Excel, allows access to Monte Carlo simulation and other advanced analytics quickly and simply on the desktop.
Conventional risk assessments attempt to model the probability of a hazard and combine that with the vulnerability of the population, to create societal risk curves and estimated values of Individual Risk per Annum (IRPA). For many of the people living on the slopes and indeed the authorities, knowing the potential number of deaths or cost from an eruption is not entirely useful, as little planning control or mitigation can be carried out. In an attempt to increase the usefulness of the risk modeling to the end-user (the authorities and people living near the volcano), BRISK has looked at the vulnerability in a different way.
Normally volcanic risk assessments assume that the whole population is present in a location when a hazard hits. However, new work by BRISK has modeled the likelihood of a successful evacuation, using both @RISK and PrecisionTree, by inputting several variables obtained through a process of structured expert judgment. These variables, which include the time taken between a possible eruption and a possible hazard hitting a location, along with communication times from authorities and evacuation times, are each estimated with an uncertainty distribution by the experts. These expert views are then weighted and pooled together. The variables are then constructed together in a logic tree within PrecisionTree, with the end node either being evacuation or no evacuation – and the probability of these outcomes being quantified, with their uncertainties. When fed back into the @RISK (Hazard * Vulnerability) model, the effects of a potential evacuation on the risk is very clear.
When looking in more detail at the model outputs from the logic tree, it became clear where the sensitivities were within the system. For example, it may be for a given location that the amount of time between a warning and the hazard hitting is crucial, or it may be that the time taken to evacuate is crucial. This new way of modeling volcanic risk informs better planning and more effective mitigation strategies.
Jonathan Stone, a researcher at the University of Bristol, working with colleagues Prof Willy Aspinall and Dr Matt Watson, said “DecisionTools Suite has proved to be invaluable in the work we are doing with INSIVUMEH, and potentially very useful for those living and working around Volcán de Fuego.”
Professor Willy Aspinall has been using @RISK software for some time in his work analyzing the risk of volcanic eruptions and earthquakes around the globe.
Originally published: Dec. 5, 2020
Updated: June 7, 2024
Professor Katsuaki Sugiura of the University of Tokyo uses Monte Carlo simulation in @RISK to improve the bovine spongiform encephalopathy (BSE) surveillance program in Japan, to improve food safety.
Professor Katsuaki Sugiura at the Laboratory of Global Animal Resource Science at the Graduate School of Agriculture and Life Sciences, the University of Tokyo, has used @RISK software since 1995 in his research activities. He has used the risk software to assess risk in the import of animals and livestock products and in food safety risk assessment. Many researchers in the specialized field of veterinary epidemiology also use @RISK, making it easy to utilize in joint research activities.
His current research is on bovine spongiform encephalopathy (BSE) – a progressive and fatal nervous disease found mainly in adult dairy cattle. The cause of BSE is oral exposure to what’s known as an abnormal prion protein. BSE is particularly worrisome because it is transmitted through meat-and-bone meal (MBM). MBM is derived from unwanted animal slaughter products and fallen stock that are cooked to give off water as steam. It is characterized by long incubation periods (2-8 years with 5 year average).
The first case of BSE in Japan was confirmed in September 2001, and a number of measures were taken to protect animal health as well as public health. One of these measures was the testing for BSE of all cattle slaughtered for human consumption from October 2001. From April 2004, all fallen-stock (cattle that died on farms or during transport) older than 24 months were also tested. As a result, through the end of 2012, 36 cows were diagnosed with BSE, from a total of 14 million heads of cattle slaughtered for human consumption and 910,000 fallen-stock carcasses tested. There are several diagnostic tests for BSE. The currently available diagnostic tests involve detection of the abnormal prion protein. Normal prion protein exists along with abnormal prion protein in the brainstems of BSE-infected cattle. The detection of abnormal prion protein is done by using proteinase-K, which digests normal prions but leaves the abnormal prions intact. But there are limits to this BSE diagnostic. At the end of the incubation period the abnormal prion proteins accumulate in the brain; in other words, even if a cow is infected it cannot be detected unless it is just before the onset of the disease. The test cannot detect the infected cattle that are slaughtered or have died from other causes before the end of the incubation period. Since the incubation period is long and varies between 2 and 8 years, the age of clinical onset is not fixed, and the age at which cattle may die or be slaughtered varies.
In Japan, all cattle butchered for human consumption are tested for BSE, as well as all cattle that died over 24 months old. However, due to the variability of the age of slaughter and death, and duration of incubation period and the limited detection capability of the diagnostic test, Professor Sugiura uses Monte Carlo simulation in @RISK to improve the surveillance program. He builds stochastic models that predict how changing the testing age of the cattle will impact the number of cattle tested and BSE infected cattle detected.
@RISK uses Monte Carlo simulation in Microsoft Excel to perform risk analysis, utilizing mathematical techniques to help better understand risks through quantitative analysis and to improve decision-making. The software can calculate the probability and impact of various possible consequences. Users can then grasp the associated risk and probability for each scenario, by tracking and objectively calculating different potential scenarios based on the formulas.
The thinking behind BSE testing model was as follows:
Four surveillance strategies were explored for cattle slaughtered for human consumption, with the minimum age at testing set at 0, 21, 31, or 41 months. Three surveillance strategies were explored for fallen stock, with the minimum age at testing set at 24, 31, or 41 months. Increasing the minimum age of testing from 0 to 21 months for both dairy cattle and Wagyu beef cattle had very little impact on the probability that a BSE-infected animal slaughtered for human consumption would be detected. Although increasing the minimum age at testing from 21 to 31 or 41 months would lead to fewer slaughtered animals being tested, the impact on the probability of detecting infected animals would be insignificant. The probability of infected Wagyu-Holstein crosses and Holstein steers being detected at slaughter or as fallen stock would be very low under all surveillance strategies.
Professor Sugiura said about @RISK, “The key point is that without having to learn any new programming language we are able to construct models right in Microsoft Excel and process them visually.” The insights provided by @RISK in Professor Sugiura’s work enables researchers to eliminate testing age as an important factor so they can focus on other, more effective factors.
Originally published: Dec. 17, 2021
Updated: June 7, 2024
The Stern Review on the Economics of Climate Change, a project of Cambridge University’s Judge Institute of Management, developed an analysis model using @RISK to investigate climate change across the world.
The Judge Institute of Management was established in 1990 to provide management teaching and research for the University of Cambridge. As well as reflecting the world-renowned status of the university, its work needs to be relevant to both its academic audience and people outside the organization. The latter group includes government bodies such as the Organisation for Economic Co-operation and Development (OECD) and the Department for Energy and Climate Change (DECC), for whom it undertakes research. Renamed the Judge Business School in 2005, its management focus also fosters technical and scientific analysis.
One such topic covered under this remit is that of climate change, and the Management Science Research Group provided key input to the Stern Review on the Economics of Climate Change. Released in October 2006, this report undertaken for the British government by Lord Stern discusses the effect of climate change and global warming on the world economy. It is the largest and most widely referenced report of its kind.
The research group developed an analysis model, PAGE2002 (for Policy Analysis of the Greenhouse Effect) using @RISK from Lumivero, previously Palisade. @RISK is an Excel add-in using Monte Carlo simulation to show all potential scenarios, as well as the likelihood that each will occur, thereby providing the decision-maker with the most complete picture possible.
PAGE 2002 was used by the staff at Stern to investigate climate change across the world. They researched issues such as the impacts of the sea level rising and increases in temperature making land infertile or unfarmable, and balanced these against the costs of various options available to tackle global warming. At one end of the scale, doing nothing costs nothing, but the environmental consequences will be high. However, activity that reduces the severity of the impacts may itself be very expensive. The aim of the model is to enable people to make informed decisions on the optimum way to deal with climate change (ie how much to cut back on damaging activity and what methods to use).
The PAGE 2002 @RISK model is an integrated assessment one, in that it aggregates information from various other sources to use as inputs. For example it uses scientific studies and knowledge for details on the climate’s sensitivity on an increase in CO2 emissions. It also combines this with economic expertise to look at the effect of an increase in temperature on gross domestic product (GDP).
Dr Chris Hope, reader in policy modelling at Judge Business School, explains: “A key problem with investigating climate change is that the different effects of the various factors which influence it are themselves, undetermined. For example, the historical evidence does not pin down exactly how much global temperatures will increase if CO2 emissions double. @RISK enables researchers to quantify this uncertainty in order that they have a measurement of the accuracy of their findings.”
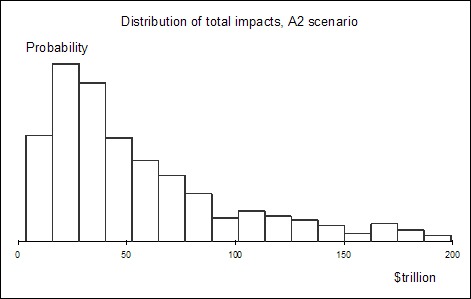
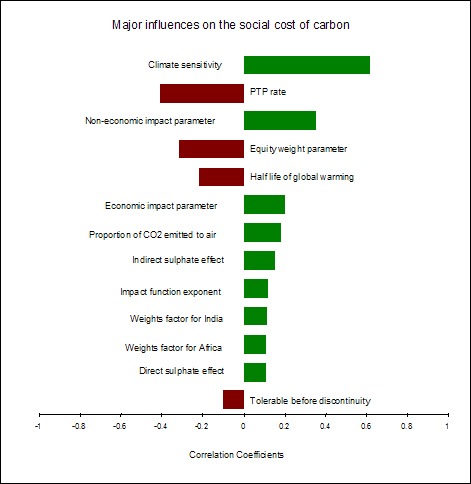
In particular, the Stern Review looked at the social cost of carbon (SCC), measured in terms of the economic impact of the extra damage done by each additional tonne of CO2 in the atmosphere. From there it could determine that if, for example, one extra tonne was going to cause $100 worth of damage in the long term, then any activity costing less than $100 which resulted in at least one less tonne of emissions was therefore both viable and desirable.
A key input to the @RISK-powered model is climate sensitivity which, using scientific evidence, is usually taken to be an increase in climate temperature of anywhere between 1.5 and five degrees Celsius per extra tonne of CO2 released into the atmosphere. Measurements like this feed into the economic impact of increased CO2 emissions, and therefore help determine the desired cutbacks on the production of greenhouse gases.
Another uncertainty the model takes into account is the length of time it could take the earth to respond to increases in greenhouse gases – for example, will this be 20 years or 50 years? This is also relevant when looking at corrective activity because it will not have an immediate effect. In addition, PAGE2002 aims to model the point at which ‘climate catastrophes’, such as the West Antarctic ice sheet melting or the Gulf Stream switching off, become possible. Referred to as the ‘Tolerable Before Discontinuity’ parameter, this is set at an increase in global temperature of between two and four degrees Celsius. (To put this in context, the present temperature rise since pre-industrial times is about 0.75 degrees).
Judge Business School then uses the RISKOptimizer element of @RISK to calculate more specific details on how much it would be best to cut back on CO2 emissions. For example, should they be reduced by sixty or eighty percent by 2050?
The next step is to work out how much it will cost to do this, in different regions of the world. Options include using alternative energy sources, such as wind turbines and nuclear power stations, reducing oil-fueled traffic and transport and halting the destruction of rainforests. As with the impacts, the exact costs of any of these activities are still not certain. However, RISKOptimizer quantifies uncertainty and, by drawing together the impact, cost implication and potential for success of each option, it enables recommendations on which cut backs will be most effective.
RISKOptimizer can also take into account that increasingly accurate information, such as a more precise figure for climate sensitivity, will become available as research progresses. It can indicate the value of this better information in terms of its potential to influence the overall recommendations.
The Judge Business School selected @RISK as a result of Dr. Hope’s knowledge of PRISM, Palisade’s (now Lumivero) original desktop risk analysis software that was developed into @RISK. He confirms: “We needed the flexibility offered by @RISK in order to build a range of models to handle the uncertainty that goes hand-in-hand with climate change and its effects. The fact that the software works in Excel also makes it easy to use and ensures that the results generated are transparent. This ensures that the outputs are understood by everyone.”
The Stern report proposed that one percent of global GDP should be invested per year in order to avoid the worst effects of climate change. Failure to do so has the potential to reduce global GDP by 20 percent.
As climate change continues to be a global issue, the Judge Business School continues to use its PAGE2002 @RISK modelling tool to advise on ways in which to tackle it.
The Judge Business School uses the Industrial version of @RISK.
Key @RISK software features used on this project by the Judge Business School
Latin Hypercube sampling is used for uncertain sampling Graphic capability (specifically to show outputs) Tornado charts used to show which inputs are having the biggest effect on which outputs
Distributions used on this project by the Judge Business School
Triangular distributions are used most often because they are the most simple distributions that are not symmetrical. Non-symmetrical distributions are needed when the sign of an effect is known, but its magnitude is very uncertain. Log logistical distributions are used for inputs that have long tails: the potential to differ greatly from their most likely value, but with only a small chance.
Originally published: Dec. 17, 2021
Updated: June 7, 2024
To address complicated debt portfolio and capital investment problems, Dr. Emmanuel Donkor uses Lumivero software @RISK and RISKOptimizer. His research has led to new and better methods for addressing financial statistical problems, using @RISK.
When multiple sources of debt with different financing terms are available to the decision maker–for example, a ten-year loan with 5% interest, and a 5-year loan with 10% interest–the environment is fraught with uncertainty. “The challenge is to determine an appropriate or optimal mix of these different debt sources that simultaneously maximizes project value and reduces the risk of default,” explains Dr. Emmanuel Donkor, a quantitative analyst and faculty member of the School of Engineering and Applied Sciences (SEAS) at George Washington University. To address complicated debt portfolio and capital investment problems, Donkor uses Lumivero software, previously Palisade, @RISK and RISKOptimizer. His research has led to new and better methods for addressing financial statistical problems, using @RISK.
Dr. Donkor used Lumivero software tools @RISK and RISKOptimizer to conduct two separate research projects published in the journal the Engineering Economist. The first tackled the improvement of debt portfolios for financing capital investment plans, while the other project empirically tested stochastic dominance relationships in risky capital investments.
In his first project published in the Engineering Economist, Donkor, along with Associate Professor Michael Duffey, addressed the question of how project promoters, who wish to use project finance as a procurement vehicle, can choose an optimal debt portfolio. The aim for these promoters is to develop a portfolio that maximizes project value but minimizes default risk when project cash flows are uncertain, and when debt with different financing terms can be sourced from multiple sources. For example, the promoter may face the previously-mentioned situation of multiple sources of debt with different financing terms—such as a ten-year loan with 5% interest, and a 5-year loan with 10% interest. “It is a difficult problem because the environment is fraught with uncertainty,” says Dr. Donkor.
To address this decision problem, Dr. Donkor and Dr. Duffey used @RISK and RISKOptimizer to help analyze and then recommend an appropriate mix of different debt instruments for financing a capital investment project. “RISKOptimizer allows the analyst to incorporate what’s known as probabilistic or chance constraints—this ensures that the risk of defaulting on loan payments, in any given period of the loan tenure is limited to say 5%,” says Dr. Donkor. They first developed a stochastic financial model in Excel, and used RISKOptimizer’s simulation optimization capability to select an optimal mix of fixed-rate debt instruments such that default occurred no more than 5% of the time. They then used @RISK simulation to evaluate the performance of the debt policy prescribed by the optimization model.
This new approach improves on the traditional methods used in risk analysis in capital investment planning, in which analysts would “take the value of debt as given, and simulate it without taking into consideration the probability of default on debt service each year,” says Dr. Donkor. “Furthermore, analysts do not consider multiple sources of debt with different financing terms—you hardly ever see debt portfolios with different terms and interest rates—it’s usually homogenous, with debt having one tenure and one interest rate.” Dr. Donkor and Dr. Duffey’s new approach, which shows how to model chance constraints in a spreadsheet environment, and implement it with RISKOptimizer, has sparked interest in the field. The paper detailing their work has become one of the highest ranked articles in the Engineering Economist.
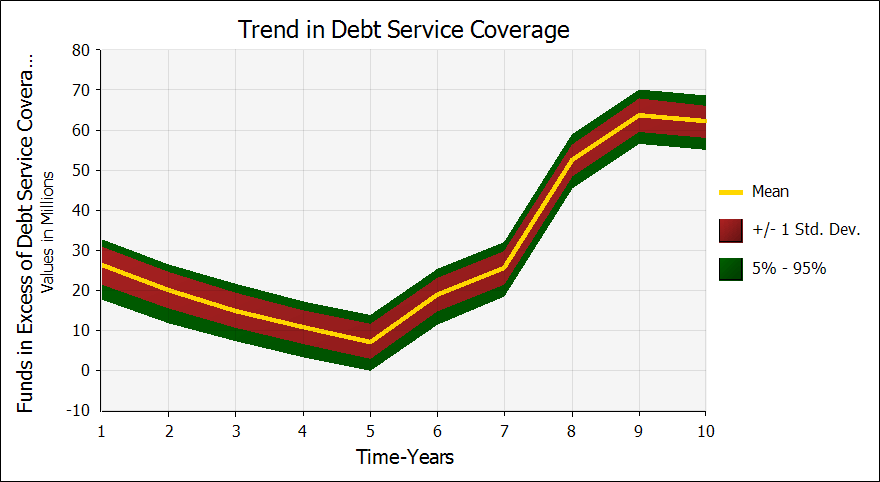
Figure 1: The profile of excess earnings after debt service, indicating that the chances of defaulting on debt service are well contained.
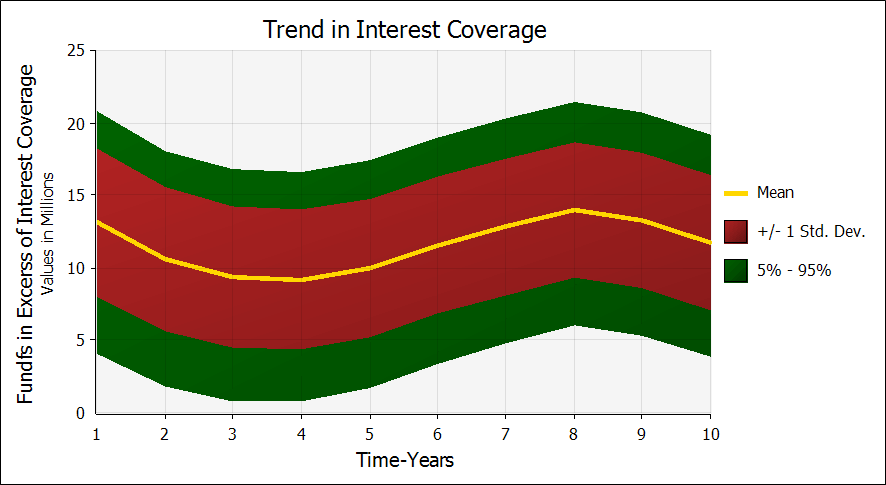
Figure 2: Plot of excess earnings after interest coverage.
Dr. Donkor also addressed the problem that analysts face when they must choose between multiple, risky, mutually exclusive capital investments. He did this by creating a spreadsheet framework that uses @RISK to implement empirical tests of stochastic dominance—a term used in decision theory which describes the ranking of random prospects based on preferences regarding outcomes. As a result of Dr. Donkor’s work, analysts involved in comparing risky capital investments do not have to rely on qualitative and visually-based ‘best guesses’.
This solution benefits those who are faced with investment choices in which only one option can be selected. For example, a person owns a building, and has to decide whether to rent it out as residential apartments or as a factory. “You can’t do both at the same time,” says Dr. Donkor, “so you have to choose one option.”
Typically these kinds of opportunities are compared by using decision rules based on the mean-variance criterion (selecting portfolios based on the means and variances of their returns) or safety-first criterion (setting a minimum required return for a given level of risk). However, at times, the mean variance criterion and its variants result in an efficiency frontier in which more than one investment option offers maximal expected return for some given level of risk, and minimal risk for some given level of expected return. This can make it difficult to select only one option.
“The problem becomes complicated when you have opportunity A, which gives you the highest value, but it has a high risk, and opportunity B, which will give you lower value but a lower risk,” says Donkor. “As a decision maker, you want high value and low risk, but these qualities are not always enshrined in the same opportunity.” For such problems, stochastic dominance rules, typically implemented by visually inspecting the cumulative distribution functions (CDF) of the alternatives, are applied. However, for many practical applications, it is common for the distributions to cross tails, creating what’s known as the ‘tail problem’. In these circumstances, analysts apply what’s known as ‘almost stochastic dominance’ (ASD), which allows decision makers to ignore the crossing at the tails so that dominance inferences can be made.
These approaches are inexact and lack quantitative certainty; on top of these issues, Dr. Donkor says that most analysts do capital planning problems in Microsoft Excel, but are not able to make stochastic dominance inferences in that program. “A theory has been developed, but no one has turned that theory into a code in Excel where it can be used,” says Dr. Donkor. Thus, the majority of practitioners, researchers, and students who analyze alternative capital investment plans under uncertainty in Excel are limited to using either visual inspection or ASD without any empirical support.
Dr. Donkor has improved this process with his @RISK-enabled spreadsheet framework which empirically tests stochastic dominance. Now, instead of using a visual best guess, analysts can use an @RISK model to empirically test for the best option among many, allowing them to make empirically defensible decisions when comparing risky capital investments.
Originally published: June 16, 2021
Updated: June 7, 2024
Researchers at the University of California San Diego School of Medicine used @RISK and PrecisionTree to create a more effective and nuanced screening program for the Hepatitis B virus in Asian populations in their region. In some communities, the rate of Hepatitis B infection can be as high as 16-18%. The models and decision trees created using Lumivero software, previously Palisade, helped the scientists determine which type of screening test to administer, and what location was most effective (e.g. health clinic versus community event), when considering widely different segments of the Asian immigrant population. This information has informed both San Diego County and the U.S. Preventive Services Task Force in their public health policy approaches.
The Hepatitis B virus is 100 times more infectious than HIV, and kills more than 780,000 people each year. It can cause a potentially life-threatening liver infection often leading to cirrhosis and liver cancer. “It’s really a devastating disease,” says Dr. John Fontanesi, Director of the Center for Management Science in Health at University of California San Diego School of Medicine and part of a team of investigators exploring better ways to both prevent and treat Hepatitis B and C. It’s also preventable with a series of vaccinations and, if caught early, can be managed much like other chronic diseases with appropriate drugs--letting those treated lead normal productive lives.
The virus seems a perfect candidate for a widespread screening program. However, Dr. Fontanesi explains this hasn’t been the case. “The U.S. Preventative Services Task Force has spent over 30 years investigating the societal cost-benefits of universal Hepatitis B screening, and to date the studies indicate such screening just isn’t worth it.”
Dr. Fontanesi and the study team led by Dr. Robert Gish, M.D., however, took a more nuanced view of the issue. After dedicated field work and the help of @RISK modeling, the researchers arrived at some entirely different findings that now have the U.S. Preventative Services Task Force (USPSTF) re-tooling their Hepatitis B screening recommendations.
If one considers the U.S. population as a whole, its rate of Hepatitis B infection is “less than a half percent,” says Dr. Fontanesi, a statistic that factored into the USPSTF’s initial decision against widespread screening. However, “Hep B isn’t evenly distributed across all ethnicities and races,” says Dr. Fontanesi. “While it’s very low in Europeans, the rate is as high as 16-18% in Asians.” Indeed, according to the CDC, Asian and Pacific Islanders account for more than 50% of Americans living with chronic Hepatitis B. The disease is particularly prevalent in Asian immigrant populations. Thus, while screening the entire American population does not yield enough benefits to outweigh the costs, the math changes if one considers screening this particular ethnic group.
But how best to screen this population? “All Asians’ isn’t a meaningful term,” explains Dr. Fontanesi. “Using San Diego as an example, there are two very different Asian immigrant populations,” he says. One is made up of university students, post docs and faculty and professionals with relatively high socioeconomic status; the other is made up of Laotian and Hmong and Vietnamese immigrants who tend to have lower socioeconomic status. “The only thing they really have in common is their susceptibility to Hepatitis B.” Given how different the income levels and likelihood of having health insurance and access to care are between these two populations, “we thought why not fit screenings to the specific population?” says Dr. Fontanesi.
The team examined two different variables in their screening efforts: the kind of test performed, and where it is conducted. They examined two different kinds of tests: standard care testing, and point-of-care testing. Standard care testing involves taking a blood sample, typically at a clinic, processing that sample at a lab, and waiting two weeks to get highly accurate results. Point-of-care testing occurs at the site of patient care, wherever that may be, and results--while less accurate and comprehensive--are available in 15-20 minutes.
The team also examined the location of testing—either a doctor’s office or clinic, or at community events where groups of Asian immigrants would gather, such as festivals or celebrations, that were used as opportunities for outreach and testing.
“We looked at these two axes—point of care versus standard care, and community event versus doctor’s offices, and looked at the number of people tested, the likelihood of someone testing positive, and how hard it is to get ahold of them for follow-up treatment or vaccination,” says Dr. Fontanesi. “As you can imagine, that’s a lot of conditions or states, so we used @RISK to build a Markov model in order to determine which of these efforts were worthwhile to do.”
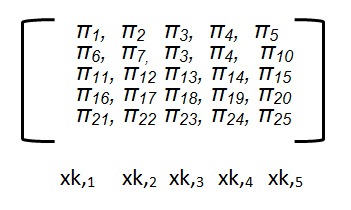
Markov models are stochastic simulations in which the probability of each event depends only on the state of the event before it. The five major possible mutually exclusive “states” are expressed as:
After running the simulation in @RISK and reviewing the results in PrecisionTree, the team had a list of possible outcomes, demonstrating the significant impact that small changes in early detection rates can make in both costs and lives saved. Dr. Fontanesi and his team converted these outcomes into a set of questions that could be used to decide what the best method of screening is for a given community.
The results from the model showed that for the San Diego Area, wealthier, more educated Asian immigrant populations were better served by Standard of Care testing conducted in their doctor’s office; it allowed for better continuity of care, referral to specialists, and long-term health savings. For poorer immigrant populations, point-of-care tests held at community events yielded better results, as many individuals in those groups were difficult to get ahold of for follow-up on test results and treatment.
This information proved so valuable that San Diego County incorporated it into a Geographic Information System (GIS) which superimposes over census information on the local populations, along with socioeconomic status and likelihood of using public or private transportation. “This information has allowed them to be really focused on targeting whether they’re going to be doing standard of care or point of care testing, and if they’ll do testing in the community or in a clinic,” says Dr. Fontanesi. “So we were able to help them match the screening policy to the community, rather than use a standard public health approach.”
The information has also informed the USPSTF in reassessing their policy towards Hepatitis B screening. They are currently re-writing their recommendation to include targeted screening of certain Asian communities and populations, thanks to Dr. Fontanesi’s findings.
Dr. Fontanesi says that @RISK was integral to his study’s nuanced approach. “In research, we tend to state problems monolithically—‘is this good or not’—but most of life is not that clear cut,” he says. “Much of life is, ‘it depends’, and we were able to use @RISK to quantify ‘it depends’, to tell us what it actually means when we say that.” He adds that @RISK’s graphical visuals were an invaluable feature as well. “When you’re trying to communicate statistics to the medical community, people can get lost, but if you show them @RISK, they get it instantly; that visual representation is so much more powerful than written text or a table of numbers.”
Originally published: Oct. 7, 2022
Updated: June 7, 2024
When people talk about leverage, they are most likely talking about financial instruments or mechanical advantage. But when Phil Rogers talks about leverage, he could very well be referring to the use of powerful PC software. Phil teaches Managerial Decision Making to MBA candidates at the University of Houston’s C. T. Bauer College of Business where most of his students are managers with industry experience—and this is where leverage from software comes in.
These students need analytical tools that offer both a short learning curve and the ability to accurately model their real-life problems. Phil uses Lumivero's DecisionTools Suite in the classroom because “the leverage you get by using these tools in Excel is phenomenal. My students can very quickly learn and apply the techniques they see in class to difficult decision-making problems faced by their firms.”
To complement the quantitative analysis provided by the DecisionTools Suite, Phil uses a stand-alone tool called Expert Choice, which is excellent at dealing with the more qualitative objectives and criteria that go into the decision-making process.
Given their industry experience, students in Phil’s decision-making classes have current problems they are dealing with on which they can use the newly learned tools and techniques. One team of students developed a model to find the optimal allocation of 1,000 turbines to five wind farms. Students working for a major oil company optimized the frequency of scheduled plant shutdowns. Yet another student, working for a giant natural gas enterprise, determined the most cost-effective use of its inventory in the face of uncertain demand for gas and the changing spot price for gas. And another student, working at one of Houston’s largest hospitals, developed a model to determine the optimal deposit for the hospital to collect from patients undergoing organ transplant operations given uncertainties in insurance coverage and the ultimate cost of the procedures.

Phil Rogers teaches students how to make effective decisions
Perhaps the students in greatest need of the “leverage” this software offers are the managers from Sinopec and CNPC, the two largest petrochemical companies in China. As part of their Executive MBA program offered in Beijing through the C. T. Bauer College of Business, these students have three days and evenings to learn the material normally taught over a semester back in Houston and, on the fourth day, to present the results of their application of what they have learned to decision-making problems they currently face. Phil reports, “They are able to do it, solving significant business problems.” And, he points out, that couldn’t happen without real leverage.
Originally published: Oct. 12, 2022
Updated: June 7, 2024
Many California produce farm operations use a rule-of-thumb to determine a hedge ratio for their seasonal productions. They often aim to contract 80% of their crop in advance to buyers at set prices, leaving the remaining 20% to be sold at spot prices in the open market. The rationale for this is based on many years of experience that indicates costs and a reasonable margin can be covered with 80% of production hedged by forward contracts. The hope is the remaining 20% of production will attract high prices in favorable spot markets, leading to substantial profits on sales. Of course, it is understood spot prices might not be favorable, in which case any losses could be absorbed by the forward sales.
Since the Recession of 2008, agricultural lenders and government regulators have recognized that many farm operators need to manage the risks to their margins, and free cash flows, rather than simply focusing revenue risks. A more quantitative analysis is needed to determine risks in the agricultural industry.
Agribusiness experts from Cal Poly conducted a risk management analysis using @RISK, and found the 80% hedge ratio rule-of-thumb is not as effective as assumed. Growers do not profit from spot market sales over the long run. The analysis shows growers are better off in the long-term selling as much of their product as possible using forward contracts.
Agriculture in California is big business. In 2013, nearly 80,000 farms and ranches produced over 400 commodities – the most valuable being dairy, almonds, grapes, cattle, and strawberries – worth $46.4 billion. Almost half of this value came from exports. The state grows nearly half of the fruits, nuts, and vegetables consumed in the United States. Yet agriculture is traditionally one of the highest risk economic activities.
Steven Slezak, a Lecturer in the Agribusiness Department at Cal Poly, and Dr. Jay Noel, the former Agribusiness Department Chair, conducted a case study on an iceberg lettuce producer that uses the rule-of-thumb approach to manage production and financial risks. The idea was to evaluate the traditional rule-of-thumb method and compare it to a more conservative hedging strategy.
The grower uses what is known as a ‘hedge’ to lock in a sales price per unit for a large portion of its annual production. The hedge consists of a series of forward contracts between the grower and private buyers which set in advance a fixed price per unit. Generally, the grower tries to contract up to 80% of production each year, which stabilizes the grower’s revenue stream and covers production costs, with a small margin built in.
The remaining 20% is sold upon harvest in the ‘spot market’ – the open market where prices fluctuate every day, and iceberg lettuce can sell at any price. The grower holds some production back for spot market sales, which are seen as an opportunity to make large profits. “The thinking is, when spot market prices are high, the grower can more than make up for any losses that might occur in years when spot prices are low,” says Slezak. “We wanted to see if this is a reasonable assumption. We wanted to know if the 80% hedge actually covers costs over the long-term and if there are really profits in the spot market sales. We wanted to know if the return on the speculation was worth the risk. We found the answer is ‘No’.”
This is important because growers often rely on short-term borrowing to cover operational costs each year. If free cash flows dry up because of operational losses, growers become credit risks, some cannot service their debt, agricultural lending portfolios suffer losses, and costs rise for everybody in the industry. Is it a sound strategy to swing for the fences in the expectation of gaining profits every now and then, or is it better to give up some of the upside to stabilize profits over time and to reduce the probability of default resulting from deficient cash flows?
Slezak and Noel turned to @RISK to determine an appropriate hedge ratio for the grower.
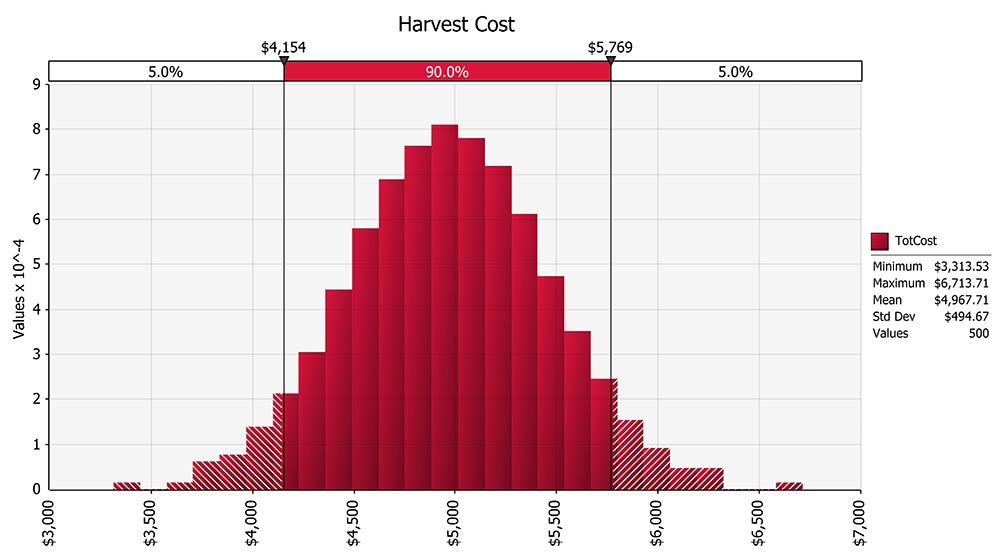
For inputs, they collected data on cultural and harvest costs. Cultural costs are the fixed costs “necessary to grow product on an acre of land,” such as seeds, fertilizer, herbicides, water, fuel etc., and tend to be more predictable. The researchers relied on the grower’s historical records and information from county ag commissioners for this data.
Harvest costs are much more variable, and are driven by each season’s yield. These costs include expenses for cooling, palletizing, and selling the produce. To gather data on harvest costs for the @RISK model, Slezak and Noel took the lettuce grower’s average costs over a period of years along with those of other producers in the area, and arrived at an average harvest cost per carton of iceberg lettuce. These costs were combined with overhead, rent, and interest costs to calculate the total cost per acre. Cost variability is dampened due to the fact that fixed costs are a significant proportion of total costs, on a per acre basis.
The next inputs were revenue, which are defined as yield per acre multiplied by the price of the commodity. Since cash prices vary, the grower’s maximum and minimum prices during the previous years were used to determine an average price per carton. Variance data were used to construct a distribution based on actual prices, not on a theoretical curve.
To model yield, the grower’s minimum and a maximum yields over the same period were used to determine an average. Again, variance data were used to construct a distribution based on actual yields.
StatTools, included in DecisionTools Suite, was used to create these distribution parameters. @RISK was used to create a revenue distribution and inputs for the model. With cost and revenue simulation completed, the study could turn next to the hedge analysis.
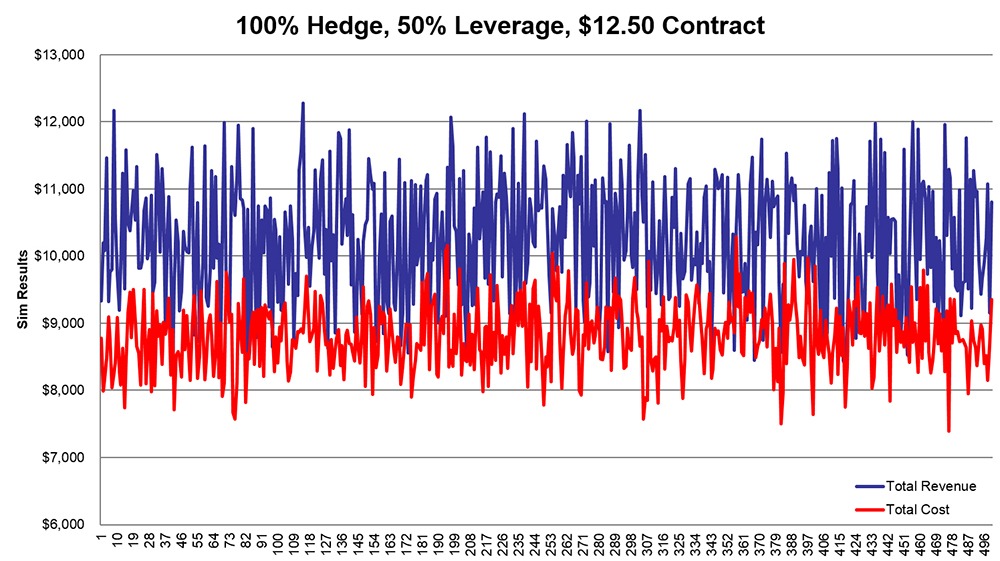
Since the question in the study is about how best to manage margin risk – the probability that costs will exceed revenues – to the point where cash flows would be insufficient to service debt, it was necessary to compare various hedge ratios at different levels of debt to determine their long-term impact on margins. @RISK was used to simulate combinations of all costs and revenue inputs using different hedge ratios between 100% hedging and zero hedging. By comparing the results of these simulation in terms of their effect on margins, it was possible to determine the effectiveness of the 80% hedging rule of thumb and the value added by holding back 20% of production for spot market sales.
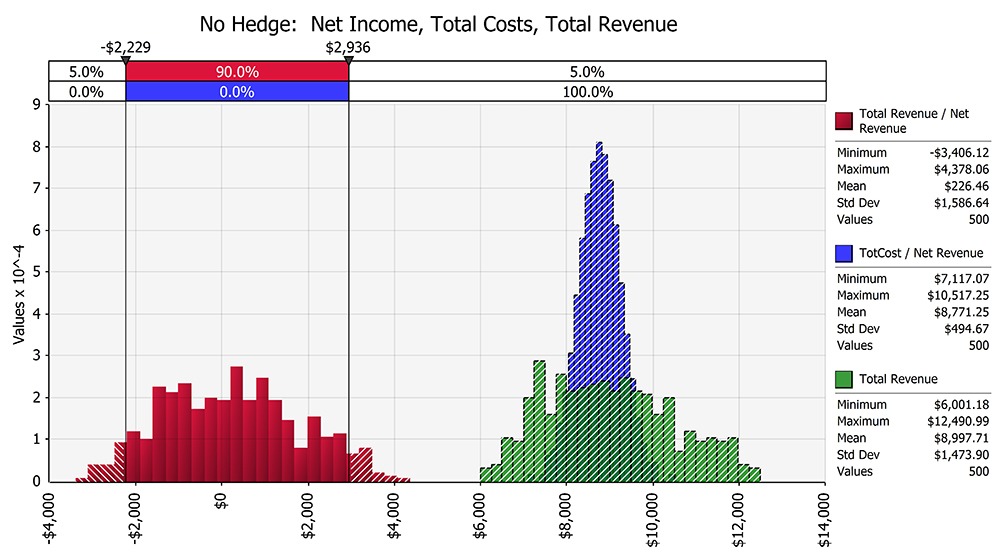
Unsurprisingly, with no hedge involved, and all iceberg lettuce being sold on the sport market, the simulation showed that costs often exceeded revenues. When the simulation hedged all production, avoiding spots sales completely, the costs rarely exceeded revenues. Under the 80% hedge scenario, revenues exceeded costs in most instances, but the probability of losses significant enough to result in cash flows insufficient to service debt was uncomfortably high.
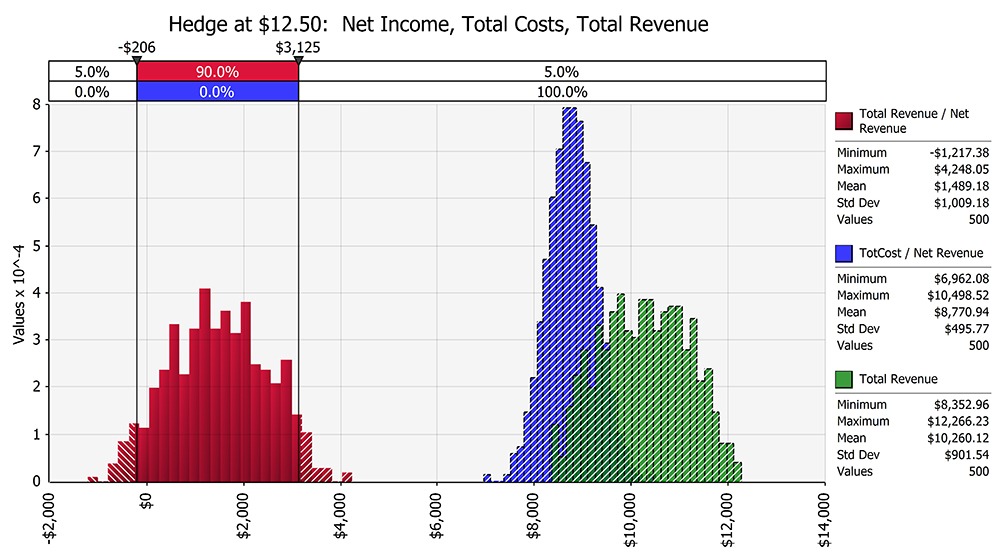
It was also discovered that the 20% of production held back for the purpose of capturing high profits in strong markets generally resulted in reduced margins. Only in about 1% of the simulations did the spot sales cover costs, and even then the resulting profits were less than $50 per acre. Losses due to this speculation could be as large as $850 per acre. A hedging strategy designed to yield home runs instead resulted in a loss-to-gain ratio of 17:1 on the unhedged portion of production.
Slezak and his colleagues reach out to the agribusiness industry in California and throughout the Pacific Northwest to educate them on the importance of margin management in an increasingly volatile agricultural environment. “We’re trying to show the industry it’s better to manage both revenues and costs, rather than emphasizing maximizing revenue,” he says. “While growers have to give up some of the upside, it turns out the downside is much larger, and there is much more of a chance they’ll be able to stay in business.”
In other words, the cost-benefit analysis does not support the use of the 80% hedged rule-of-thumb. It’s not a bad rule, but it’s not an optimal hedge ratio.
Professor Slezak is a long-time user of @RISK products, having discovered them in graduate school. In 1996, “a finance professor brought the software in one day and said, ‘if you learn this stuff you’re going to make a lot of money,’ so I tried it out and found it to be a very useful tool,” he says. Professor Slezak has used @RISK to perform economic and financial analysis on a wide range of problems in industries as diverse as agribusiness, energy, investment management, banking, interest rate forecasting, education, and in health care.
Originally published: Oct. 13, 2022
Updated: June 7, 2024
Dr Agustinus Bandur uses NVivo to improve the quality of education in Indonesia.
One of the driving influences behind improving the quality of education across Indonesia’s schools and higher education institutions is Dr Agustinus Bandur. A senior lecturer and strategic research & partnership leader at BINUS University in Jakarta, Dr Bandur has spent more than 15 years researching how to improve leadership and management in education across Indonesia. Dr Bandur also consults to several not-for-profit organizations, including the Florenza Children Resources Center, which he founded in 2008 to help children improve their learning.
For Dr Bandur, the issue of improving Indonesia’s education system is compounded by its sheer size and diversity.
With more than 50 million students and 2.6 million teachers in more than 250,000 schools, it is the fourth largest education system in the world, behind only China, India and the United States.
While Indonesia has made major progress in improving its primary and secondary education, serious issues remain around the drop-out rates of students. According to the 2016 National Socio-Economic Survey, around one million children between 7 – 15 years old are not attending primary or junior secondary school. Meanwhile, another 3.6 million adolescents aged 16 to 18 are out of school. There are also concerns around the quality of learning at Indonesian schools. According to UNICEF, only 81% of primary school teachers hold the minimum qualifications required by government.
Dr Bandur’s research has been central to discussions around school-based management (SBM) policy reform in Indonesia, which saw education decentralize and shift responsibility to schools in 2005 in an effort to improve management within the education sector. In response to higher education globalization in Indonesian universities, Dr Bandur has also focused his research on higher education internationalization.
While Dr Bandur has plenty of passion for improving Indonesia’s education management and leadership, what he doesn’t have is a lot of time. With so many projects, educational institutions and not-for-profit organizations are relying on his research insights, Dr Bandur realised early on that he needed a faster, more efficient way of collecting, managing and analyzing his research data.
In 2002, Dr Bandur began using NVivo, software designed to support qualitative data analysis. Since then, Dr Bandur relies on it almost every day for his research needs, from conducting literature reviews to content analysis of various sources, thematic and cross-case analysis, as well as mixed-methods research. He also uses NVivo to ensure his articles and books are based on authentic, evidence-based data.
NVivo is the number one software chosen by academics around the world for presenting the most robust, defensible findings from qualitative research. According to Dr Bandur, NVivo saves him significant time and
effort, particularly with queries for content analysis, cluster analysis and visualizing themes, as well as with transcribing data.
“For any qualitative research, transcribing is tiring,” said Dr Bandur. “Prior to learning about NVivo, I would have to listen to interviews in Windows Media Player and transcribe them into Microsoft Word. It meant having two programs opened at the same time, which took time to use and control. In NVivo, I can hear, see and manage my recorded data much more effectively and efficiently. It is also fascinating with NVivo to capture and transcribe secondary data from YouTube videos prior to conducting primary data collection in the field.”
“Another advantage of NVivo is that I do not have to read all the references to make sense of the data. Instead, with the query system in NVivo, I can search the main theme, word or topic that I am analyzing, saving me from having to skim through hundreds of papers and potentially miss important information. NVivo is also a perfect tool for me as it integrates my papers managed in Mendeley.”
“Finally, NVivo adds credibility to my research. It allows me to quickly create project mappings, analyze the attributes and perform cross-case analysis. The triangulation technique – combining data from different sources such as interviews, focus groups and photos – is something I use frequently to improve the strength of my findings. I also find team research helps. With NVivo, my research team can work on the same project, allowing us to conduct inter-rater analysis to measure reliability.”
According to Dr Bandur’s research, there is evidence that the implementation of the SBM policy has resulted in improving teaching learning environments and student achievements. He continues to study its effects and train others – along with advocating NVivo as a best practice way to collect, manage and analyze data. “The NGOs I work with, including Wahana Visi Indonesia, SMERU Research Institute and Perkumpulan Prakarsa are all now using NVivo. My Doctoral and Master’s students have also applied NVivo in their Doctoral dissertations and Master’s theses. I strongly recommend NVivo to students, scholars and research because it is a powerful tool for the purposes of conducting content, thematic, and cross-case analyses in qualitative research.”
Dr Agustinus Bandur PhD, is a senior lecturer and strategic research & partnership leader at BINUS University in Jakarta. Dr Bandur has spent more than 15 years researching how to improve leadership and management in education across Indonesia. Every day, QSR International helps 1.5 million researchers, marketers and others to utilize Qualitative Data Analysis (QDA) to uncover deeper insights contained within the “human data” collected via social media, consumer and community feedback and other means. We give people the power to make better decisions by uncovering more insights to advance their area of exploration.
Dr. Anupama Shekar shares her story of following her passion for ensuring equitable access to quality education, no matter a child’s economic circumstance, and how it took her from a career in journalism in India, to post-doctoral research in the U.S. Her work has featured a long history of working with qualitative research and evaluation tools, including NVivo.
Dr. Anupama Shekar, PhD, is a qualitative researcher and program evaluator with a passion for the field of educational research and evaluation. She is currently an Evaluation Consultant with the Center on Research and Evaluation at the Simmons School of Education and Human Development at the Southern Methodist University (SMU) in Dallas, Texas. Her prior experience includes working as the Director for Evaluation at Teaching Trust in Dallas, Texas, an education leadership non-profit organization. She also worked as an associate researcher, and prior to that a post-doctoral research associate with WIDA which is a national and international prek-12 language development and assessment program housed at the Wisconsin Center for Education Research at the University of Wisconsin-Madison.
Before undertaking her postdoctoral work, she earned her PhD at the Department of Educational Leadership and Policy Analysis at the University of Wisconsin-Madison. She also assisted in the development and evaluation of WIDA’s data literacy program known as LADDER for English language learners. Funded by the US Department of Education's Office of English Language Acquisition, this project essentially helped participating schools make data-driven decisions about English language learners.
Prior to coming to the U.S., Anupama received her Master's degree in journalism at the Symbiosis Institute of Mass Communication and worked as a print journalist for the New Indian Express, a national mainstream newspaper in Tamil Nadu, Southern India. In her role as a print journalist, she focused on public educational leadership and policy issues in South India, where her journey in education began. The school leaders she met served children from low-income families. They greatly impacted her and she was inspired to leave journalism and study educational leadership and policy.
Anupama recalls why she felt compelled to change careers. “It was the initial encounter that I had with several children from low-income communities,” she said. “They really awakened my interest in studying education leadership and policy formally and improving the public school system in India.”
“Many years later, the first story I wrote for The New Indian Express in 2006, still remains on my desk, “ she said. “It continues to keep me focused on why I began this journey and the importance of working to improve the lives of children from low-income communities anywhere in the world.”
A 14-year-old girl said that she had to work to feed her mother and brothers, and could not go to school. That really stuck with Anupama. Although education is a fundamental right of children under the Indian constitution, thousands of underprivileged children still have no real access to a school or quality education. “At that point I started developing an interest in research and evaluation in education leadership. I wanted to study successful school leadership practices and leaders who advocate for children from low-income groups despite the odds,” Anupama said.
It was when Anupama’s doctorate studies and WIDA work began that NVivo came into the picture. Her professors and other researchers used it, and her own research involved writing up case studies of school leaders in public schools in Tamil Nadu, Southern India. Previous research in the U.S. had examined the contribution of parent involvement in children's educational outcomes, but very little was focused on the role of school principals in fostering parent, family and community involvement practices.
Her analysis of previous research led her to design an exploratory, qualitative, cross-case study and informed her research questions: how do public school leaders in Tamil Nadu foster parent and family involvement? And what are the similarities and differences across schools?
“I used NVivo 9 to explore the initial transcriptions of interviews, contextual observations and field notes. It gave me an initial understanding of all the data and how the school heads initiated and supported parent involvement practices at their schools,” said Anupama.
While NVivo helped gain an initial understanding of the themes in her data, Anupama also used a traditional and manual coding process while interrogating her qualitative data to unpack the complexities in her qualitative case studies.
“Manual coding helped me analyze the story of each headmaster and headmistress and see patterns. I needed to get close to the data to figure out the leaders actions more deeply,” she said. “I also used memos, and documents, and artifacts. I sort of let the curiosities as a researcher take over. I feel moving between manual and software coding really helped me with my dissertation analyses and to triangulate my own thinking and findings,” said Anupama.
She notes how innovative uses of qualitative data helped her accomplish a richer understanding of experiences in the case studies. “The main study findings were that the school heads’ over time created a continuum of overlapping actions that helped foster effective parent involvement. I was really able to get to the core of the school heads’ actions through usage of multiple analyses techniques and constant reflection on the qualitative data. As a qualitative researcher, you really commit to spending extended periods of time to get to the heart of the story” Anupama said.
During her work at WIDA during her doctorate studies, the WIDA’s LADDER project convened many focus groups, as well as individual interviews and mixed methods evaluation. “Each year we produced a program evaluation report and wrote up findings, so NVivo was useful as one of the tools that helped us identify themes and patterns,” said Anupama. “WIDA still offers the LADDER program, and I was there when they were developing the whole program from the ground up,” she said.
When Anupama moved onto her postdoctoral work, WIDA’s Teaching and Learning team were trying to understand best practices in professional learning and professional development. One large project involved multiple qualitative open-ended questions. Anupama found her prior experience helpful. “NVivo was a great tool for me to use then because we were working with a lot of diverse data and it ended up providing great insights,” she said.
Most recently she worked as the Director of Evaluation with Teaching Trust, an educational leadership non-profit in Dallas. Teaching Trust offers high quality training and support for future school leaders, school leadership teams, and teacher leaders to ensure that children in low-income schools across Texas have access to an excellent education.
“Teaching Trust has a strong alumni base and educators who graduated from Teaching Trust programs are out in the field driving positive change for students,” said Anupama. “The Teaching Trust Alumni Network team always gathered and used data effectively to drive their programmatic decisions. In this case, the team was trying to understand through qualitative data, the impact of the Teaching Trust alumni programming from the participant's point of view and how future programming might be improved and changed,” she said.
The Alumni Network team conducted qualitative focus groups of current and former participants. “After every focus group, our team met to extract meaning from the data — the impacts of Teaching Trust programming on participants, personal leadership, student and school outcomes, and what it really meant to be part of the Teaching Trust community,” said Anupama.
The team used both manual and software coding techniques with their qualitative data. “We took a grounded theory approach by listening and gathering data, and bridging perspectives to really unpack the themes and patterns” said Anupama.
“My former colleagues used pen and paper, and I used NVivo to code,” Anupama said. “There is a lot of power in combining multiple qualitative coding techniques because that adds to the validity and reduces researcher isolation. We presented the lessons learned and techniques on the collaborative qualitative approach in a webinar to the American Evaluation Association.” she said.
Anupama’s career has evolved through her interest and passion for educational research and evaluation and ensuring people have equitable access to quality education, no matter their background or economic circumstance. Her appreciation for the importance of qualitative research and evaluation has been at the heart of her work.
“Qualitative data tells you something that numbers cannot, and helps you dig deeper to explore the complexities and find powerful insights,” she said. “As a qualitative researcher and evaluator, my challenge has been to find meaning in data, to keep asking why, and to continue digging,” said Anupama.
Anupama also hopes to continue sharing the power of qualitative research and evaluation through her website and blog in the near future. “There is a renewed energy in qualitative research and evaluation that is really exciting. There are people around the world who use qualitative data in very different ways in their work. I think it will be valuable to hear and share their stories as continual learning is the core of qualitative work.”
Anupama hopes to use her learnings in qualitative research and evaluation at her current work at the Center on Research and Evaluation (CORE) at the Simmons School of Education and Human Development at the Southern Methodist University (SMU) in Dallas, Texas.
“I am excited to be doing projects for CORE and collaborating with their diverse and strong team of researchers and evaluators led by Dr. Annie Wright. They are at the forefront of conducting rigorous research and evaluation that focuses on examining critical issues around children, families and communities.
CORE is constantly striving to push boundaries and was selected as one of the Annie E. Casey Foundation’s expert evaluators nationwide. This shows the focus CORE has on issues around diversity, equity and social justice. I am honored to be learning as a researcher and evaluator with this incredible organization.”
You can follow CORE’s work on Facebook and Twitter.
Dr. Anupama Shekar, PhD, is a qualitative researcher and program evaluator with a passion for the field of educational research and evaluation. She is currently an Evaluation Consultant with the Center on Research and Evaluation at the Simmons School of Education and Human Development at the Southern Methodist University (SMU) in Dallas, Texas. Her prior experience includes working as the Director for Evaluation at Teaching Trust in Dallas, Texas, an education leadership non-profit organization. Every day, QSR International helps 1.5 million researchers, marketers and others to utilize Qualitative Data Analysis (QDA) to uncover deeper insights contained within the “human data” collected via social media, consumer and community feedback and other means. We give people the power to make better decisions by uncovering more insights to advance their area of exploration.
Dr. Etti Baranoff, an Associate Professor of Insurance and Finance at Virginia Commonwealth University in Richmond uses @RISK in her business school class, ‘Managing Financial Risk’ (taught every semester). In this class, students learn how to apply Value at Risk (VaR) analysis to understanding the measures of risks and applying tools for risk management. Dr. Baranoff’s students use @RISK to analyze which accounting data inputs (from both the balance sheet and income statements) can be most damaging to the net income and net worth of a selected company.1 The main analyses are to determine the inputs contributing the most to the VaR of the net income and net worth, the stress analysis and sensitivity analysis. Historical data is used for @RISK to determine the best fitted statistical distribution for each input, and @RISK’s Monte Carlo simulation functionality is used.
While uncovering these quantitative results for each case study of the selected company, the students try to match these “risks” with risks they map using the 10Ks reports of the company. Finding the most damaging risks (proxies by accounting data) and applying them to the risk map provides an overall enterprise risk management view of the cases under study.
Since 2009, many cases have been developed by the students, who major in financial technology, finance, risk management and insurance, and actuarial science. Featured here are two cases from Fall 2014. At the end of the semester, the class creates a large table with inputs from each of the cases studied in the class. Table 2 is used to compare the results of the companies and evaluate the risks. The class acts as a risk committee providing analytical insights and potential solutions.
For Amazon the group used @RISK to assign a distribution to each input variable collected.2 The data used was annual and quarterly data. Here we feature the quarterly results for the net worth analysis.
Each group is asked to create the statistical distributions of the historical data of each input with and without correlations (as shown in Figure 3). The simulations are run with and without the correlations. The runs are then compared. Dr. Baranoff explains that “without correlation, these results are not appropriate since the size is the most influential. By correlating the inputs, the size affect is mitigated.3 I have them do this first to show the size influence and the importance of the correlation.”
For Amazon, we show the results for the net worth using quarterly data with correlation among the inputs we see the VaR for the net worth in Figure 1.
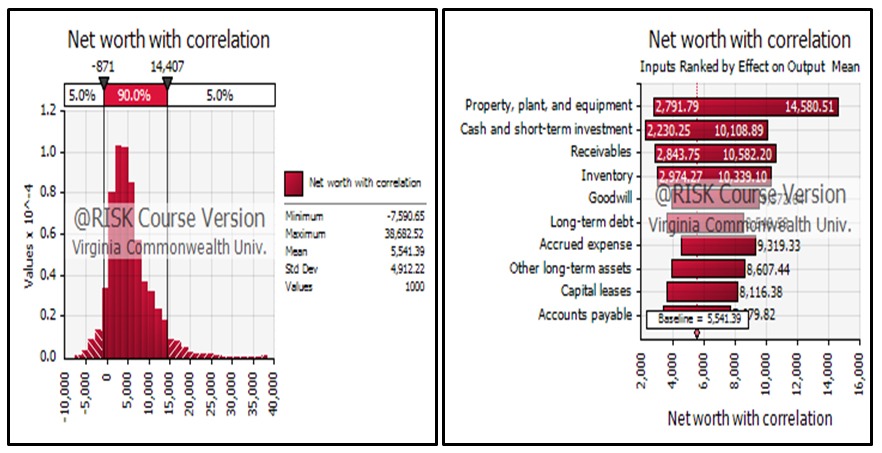 Figure 1: Value at Risk (VaR) of Amazon net-worth with correlation among the inputs
The quarterly data showed a probability of getting negative net worth at 5% value at risk, with ‘Property, plant, and equipment,’ and ‘Cash and short-term investments’ as the highest influencers of net worth. “So as far as the net worth goes,” says Dr. Baranoff, “Amazon is a strong company.” She also adds, “Interestingly the statistical distributions used for these inputs are Exponential distribution for net ‘Property, plant, and equipment,’ and ExtraValue distribution for ‘Cash and short term investments.’” These are shown in the following two graphs.
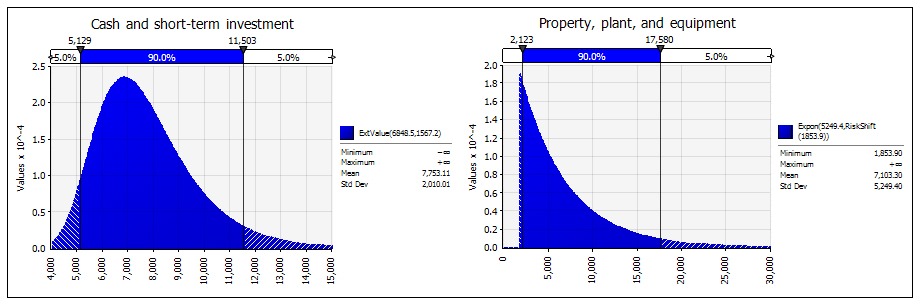 Figure 2: Amazon: Examples of statistical distributions for inputs
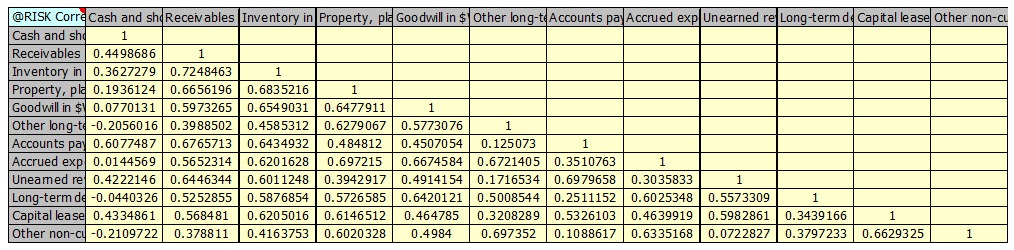 Table 1: Correlation among the applicable inputs for Amazon’s net-worth
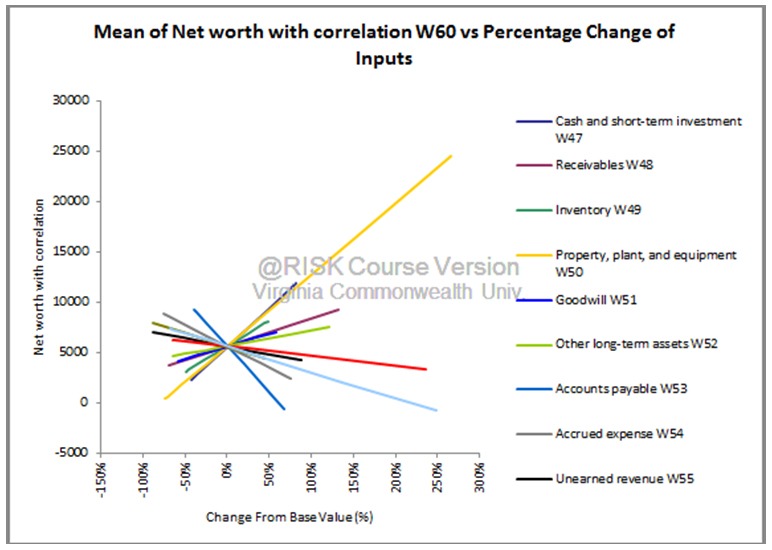 Figure 3: Sensitivity Analysis for Amazon net-worth with correlation among the inputs
Verifying the VaR results, the sensitivity analysis shows the relationship of the contribution of each of the inputs to the net worth. Again, as expected, ‘Property, plant, and equipment’ have the steepest slope. (As base value changes, ‘Property, plant, and equipment’ will have the biggest impact on net worth.)
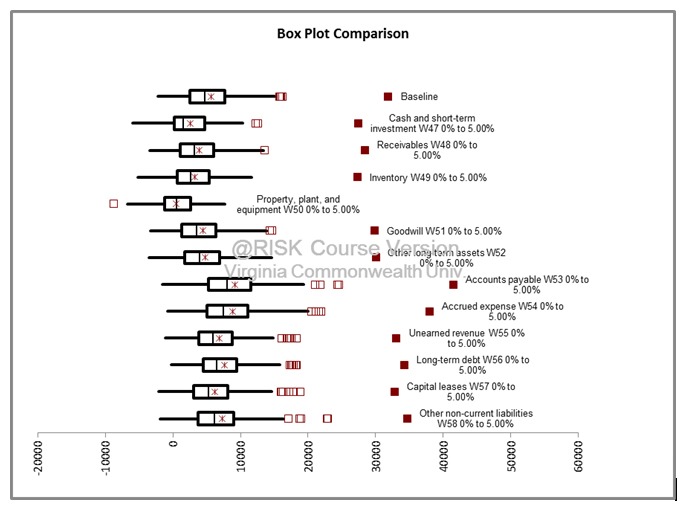 Figure 4: Stress Test for Amazon net-worth with correlation among the inputs
For the stress test4 it appears again that the ‘Property, plant, and equipment’ can stress Amazon’s net worth at the 5% VaR level.
While it is not shown here, the project also includes an examination of the inputs impacting the net income.
When the project begins, the students create a qualitative Risk Map for the company. Figure 5 is the Risk Map for Amazon. This is done independently from the @RISK analysis. The students study the company in depth using the 10K including all the risk elements faced by the company. They create a risk map based on qualitative data of ranking the risks by frequency and severity of the potential losses from the risk exposures. After they complete the @RISK analysis, they compare the results for the net worth and net income with the qualitative Risk Map’s inputs.
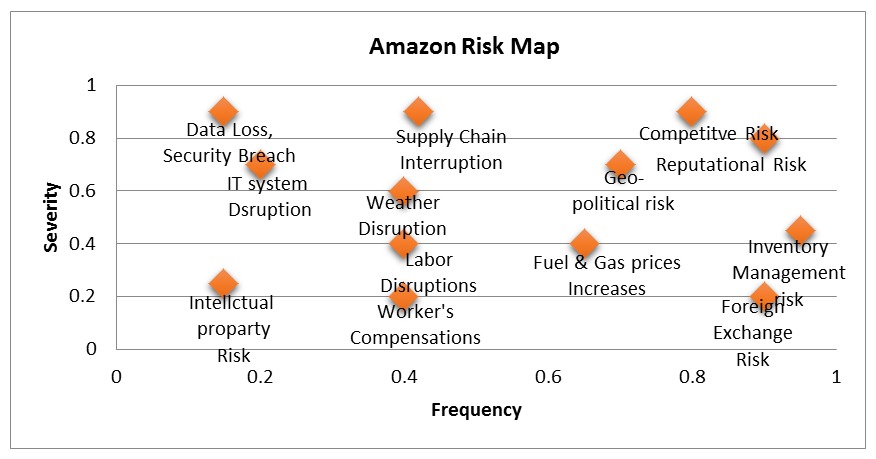 Figure 5: Risk Map for Amazon – Qualitative Analysis based on 10K Report
The @RISK analysis revealed that ‘Property, plant and equipment’ have the highest possibility to destroy the net worth of Amazon. In terms of the qualitative risk map, the connection would be to the risk of ‘Supply Chain Interruption.’ Any problems with plants’ equipment will lead to supply chain risk. Another connecting input is ‘Goodwill’ as a proxy for ‘Reputational Risk’ in the Risk Map. While it is high severity and high frequency by the students’ qualitative analysis, it is shown to have medium impact on the net worth of Amazon as per Figure 1 for the VaR analysis. Similarly, ’Goodwill’ has impact on the stress analysis in Figure 4, but, not as high as implied from the Risk Map.
For this short article, Dr. Baranoff has not discussed all the analyses done with @RISK and all the relationship to risks (inputs) in the Risk Map. Dr. Baranoff says they were able to draw conclusions about how Amazon should plan for the future: “In order to have high sales revenue, Amazon will need to maintain an excellent reputation and stay at competitive prices to avoid reputational risk and decline in market share,” she says. “Also, to avoid weather disruption risk and supply chain interruption risk, Amazon will need to diversify the locations of its properties and keep the warehouses spread across the country.”
Insurance and Finance, Virginia Commonwealth University
Dr. Baranoff’s students also analyzed the risk factors of FedEx, with the same objectives as for Amazon. The students gathered financial data from S&P Capital IQ, as well as from the FedEx investor relations website. With the information in hand, the students used @RISK for distribution fitting, stress analysis, and sensitivity analysis.
When analyzing FedEx’s risk factors, the students used the 10K of FedEx and then related them to the quantitative analysis using @RISK. A number of key areas came up, including Market risk, Reputational risk, Information Technology risk, Commodity risk, Projection risk, Competition risk, Acquisition risk, and Regulatory risk. The students created a risk map of all the factors, identifying the severity and frequency of each as shown in Table 6.
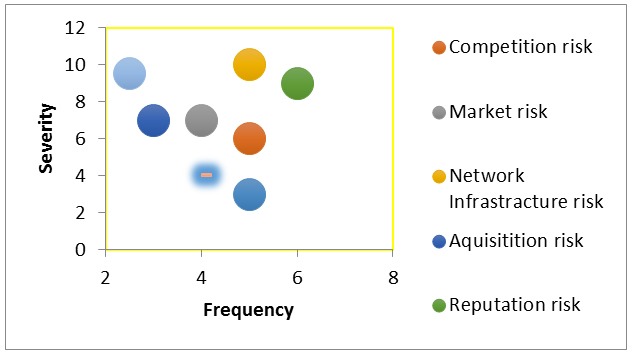 Figure 6: Risk Map for FedEx – Qualitative Analysis based on 10K Report
The distribution fitting for most of the inputs on the FedEx income statement came up as a uniform distribution. This made sense to the students based on data from the last ten years, as FedEx has been a mature company strategically placing itself to confront changing market conditions. Net income was negative at the 45% VaR for the uncorrelated data against a 40% VaR for the correlated data. ‘Revenue’ and ‘Cost of goods sold’ are the two major contributors on net income.
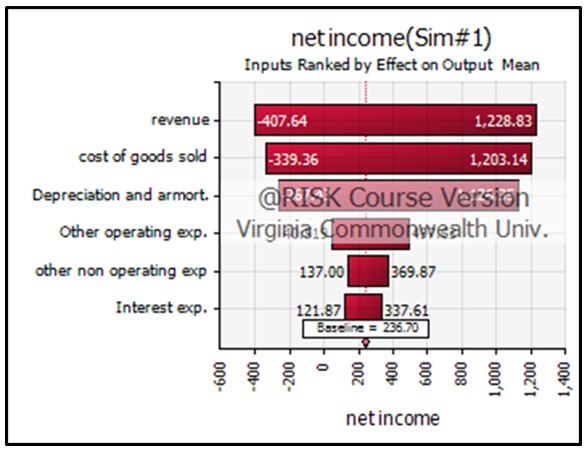 Figure 7: Value at Risk (VaR) for FedEx net-income with correlation among the inputs
The sensitivity analysis also confirms that ‘Revenue’ and ‘Cost of goods sold’ have the most influence. They are very large amounts compared to the other inputs on the income statement.
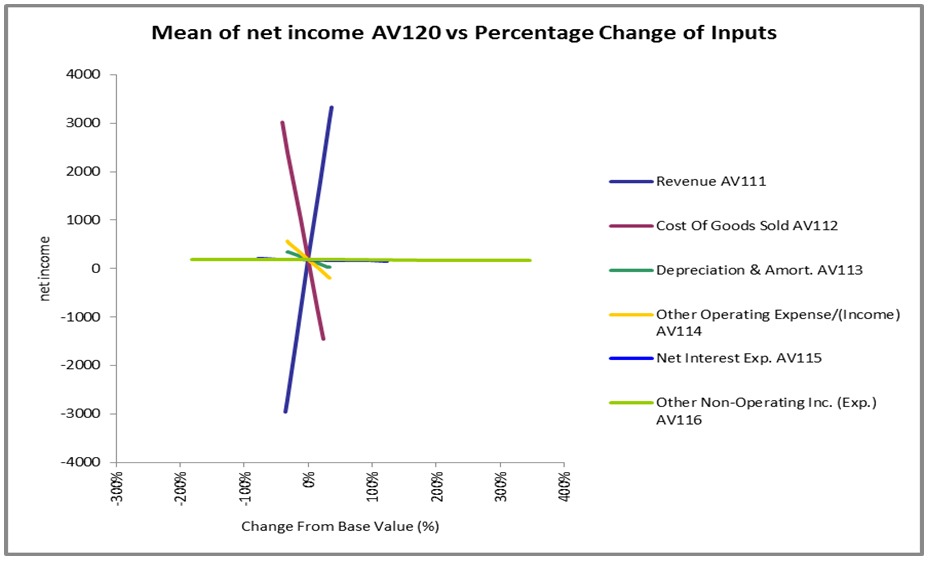 Figure 8: Sensitivity Analysis for FedEx net-income with correlation among the inputs
For the net worth, once again the most common distribution was the uniform distribution though there were a couple of normal distributions. Pensions had a lognormal distribution which is one of the most common distributions used by actuaries. Running the simulation with and without correlation had ‘Property Plant and Equipment’ (PPE) as the most influential input, but when running the simulation on the correlated balance sheet things evened out to a point where almost all the inputs had equal effects on net worth.
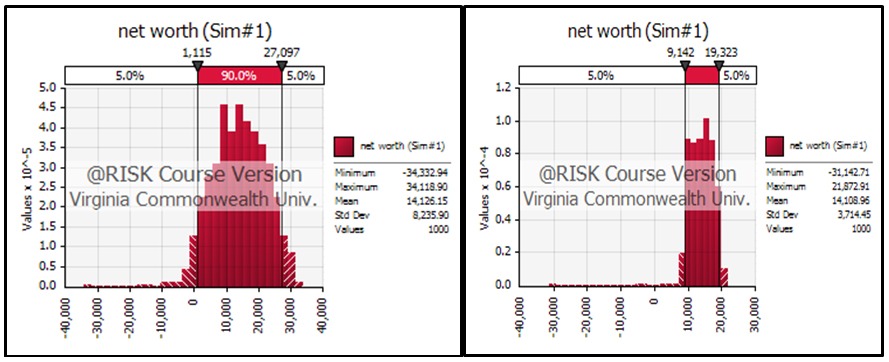
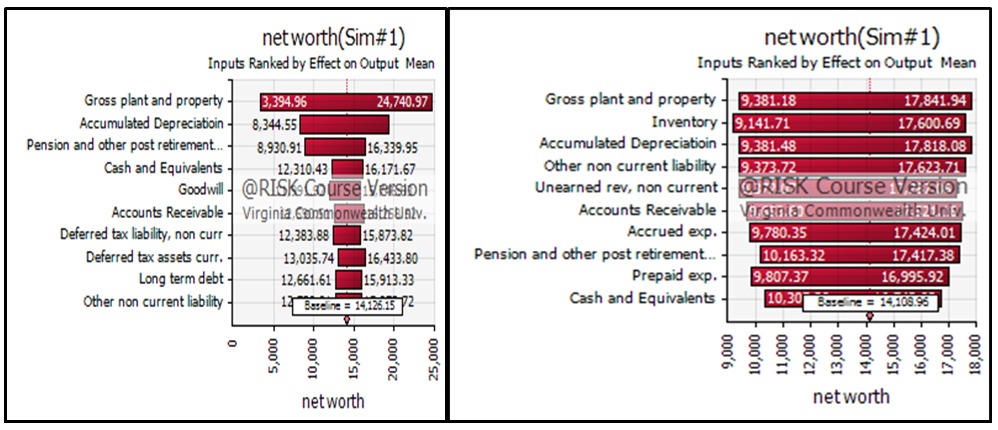 Figure 9: Value at Risk (VaR) for FedEx net-worth with correlation and without correlation among the inputs - Figures on left with correlation. Figures on right without correlation.
FedEx Segments
FedEx Corporation has 8 operating companies (FedEx Express, FedEx Ground, FedEx Freight, FedEx Office, FedEx Custom Critical, FedEx Trade Networks, FedEx Supply Chain, and FedEx Services). Since FedEx started with FedEx Express and acquired the rest of the operating companies for the segments, the data for FedEx Custom Critical, FedEx Office, FedEx Trade Networks, FedEx Supply Chain, and FedEx Services are reported in FedEx Express. The segments used by the students are therefore made up of FedEx Express, FedEx Ground and FedEx Freight. With that said, FedEx Express was the highest earner for the segments. FedEx Express had the lowest profit margin followed by freight and then ground. Where freight and ground only operate vehicles, Express operates aircraft as well, so it is logical that their expenses are higher as aircraft operations are much more expensive than vehicles. For segments without correlation, operating profit was negative all the way to the 25% VaR, but segments with correlation had positive operating profit at the 5% VaR. Also, the ranking of the inputs by effects for the segments were different for the correlated and uncorrelated inputs (see Figure 10).
Figure 10: Value at Risk (VaR) for FedEx Operating Profits with correlation
For the stress test analysis of the inputs impacting the output at the 5% VAR level, there wasn’t much of a difference between the correlated and uncorrelated segments even though the deviations from the baseline was more pronounced for the correlated than the uncorrelated segments, as can be seen in Figure 11.
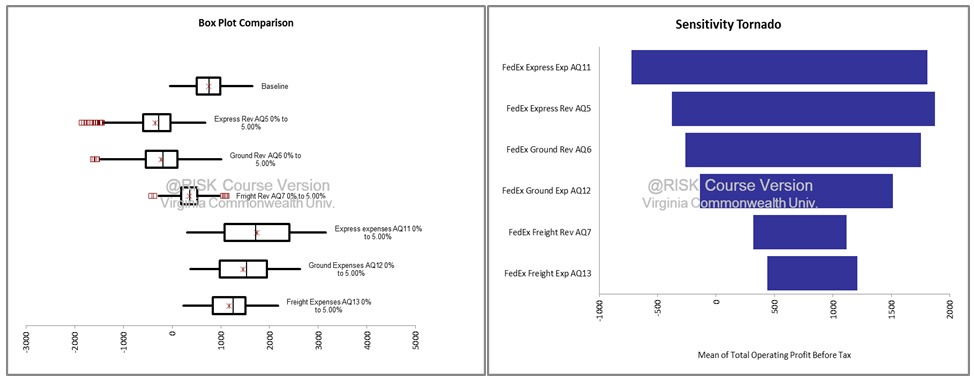 Figure 11: Stress Test for FedEx Operation Profits with correlation among the segments' inputs
The students concluded, “FedEx has strategically diversified itself to compete effectively in the global market place...Property Plant and Equipment was a big influence on net worth, but the company is constantly evaluating and adjusting this factor, so that there are no shortages or excesses.”
For Dr. Baranoff, @RISK’s ease of use is a major reason for making it the tool of choice for her classroom. Additionally, she lists its ability to provide credible statistical distributions as another major plus. “@RISK also allows me to show students the differences of selecting different statistical distributions, and the importance of correlation among some of the inputs,” she says. “Additionally, it allows us to combine the results for VaR analysis, stress analysis, and sensitivity analysis to discover what inputs can be destructive to a company’s net income and net worth. And, at the end of the day, it gives us good viewpoints to compare the results among the cases. The stories and the results lead to debate, and provide lots of fun in the classroom as the whole class become a risk committee.”
To conduct the comparison and give the tools to the risk committee to debate the risks and ways to mitigate them, the class creates Table 2.7 Table 2 is the foundation for the risk committee work. Each group is asked to provide a comparative evaluation among the cases under study (usually, about 5 cases each semester) as the second part of its case study report. This project concludes the semester.
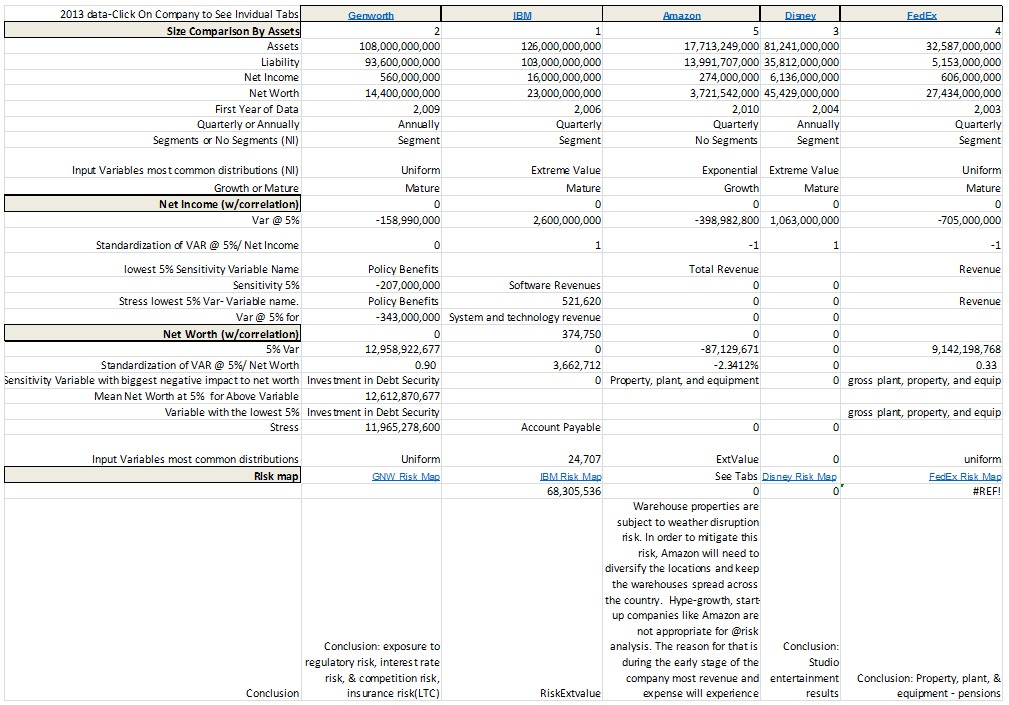 Table 2: Comparing all case studies for the Fall 2014 semester - Managing Financial Risk Course
1 Students first gathered financial statements from financial information provider S&P Capital IQ. 2 Each group attempts to have as many historical data points as possible to generate the statistical distributions. If quarterly data is available, it is used. The minimum number of observations cannot be less than 9 data points. 3 While “Accounts payable” are large in size, the input is no longer the most important variable under the correlation. As shown in Figure 1, it went to the bottom of the tornado. 4 The Stress test that is captured in the graphic takes the individual distributions that are fitted based on historical data, and stresses each inputs distribution for values that are within a specified range. In this example the range tested is the bottom 5% of the variables distribution. The goal is to measure each variable’s individual impact to an output variable when stressed. The box plots observe each stressed variable’s impact to the net worth (Assets-Liabilities) of Amazon. This test shows which variables distribution’s tails have the biggest ability to negatively or positive affect the company’s net worth at the tail of 5% value at risk net worth. Each variable is stressed in isolation, leaving the rest of the variables distributions untouched when determining the net worth values. When Assets are tested at their bottom 5% of their range, the net worth of the company is found to decrease as the distribution will be focusing on the bottom 5% of the distribution’s range resulting in less assets on the balance sheet. Likewise, when testing the bottom 5% of the liabilities, the distribution is focusing on small values for the liabilities, and due to the decrease in liabilities, net worth will increase when compared to the baseline run. 5 Each group creates its own version of the risk map as one template is not required. 6 See footnote 4. 7 We acknowledge some imperfections in Table 2, but it serves its purpose as a stimulating starting point for dialogue. 8 The students deserve recognition for their excellent work on the case studies presented in the matrix below. They are: Agack, Adega L., Alhashim, Hashim M., Baxter, Brandon G. Coplan, Thomas P., Couts, Claybourne A., Gabbrielli, Jason A., Ismailova, Railya K., Liu, Jie Chieh, Moumouni, As-Sabour A., Sarquah, Samuel, Togger, Joshua R.
Originally published: Oct. 28, 2022